. 2000 Mar 14;97(6):2556-61.
doi: 10.1073/pnas.050588497.

Clustering of connexin 43-enhanced green fluorescent protein gap junction channels and functional coupling in living cells

Affiliations

Clustering of connexin 43-enhanced green fluorescent protein gap junction channels and functional coupling in living cells

F F Bukauskas et al. Proc Natl Acad Sci U S A. .

Abstract

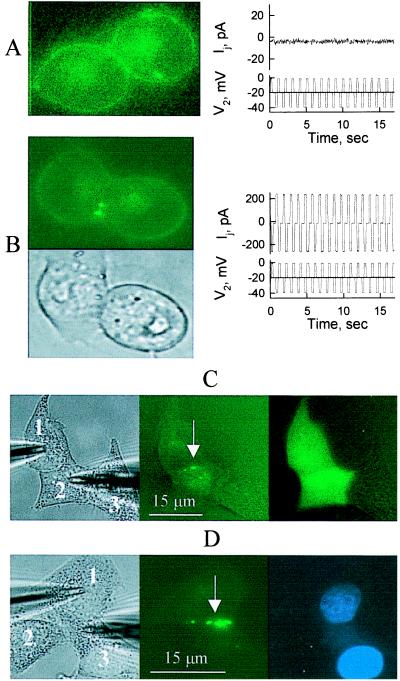
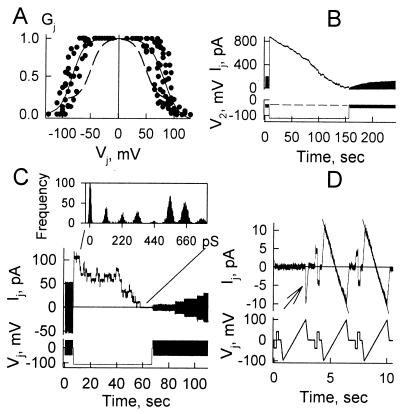
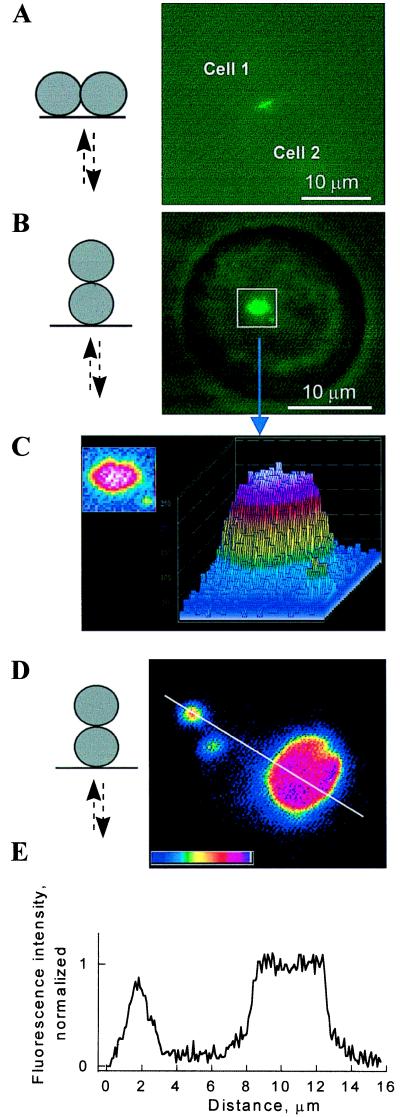
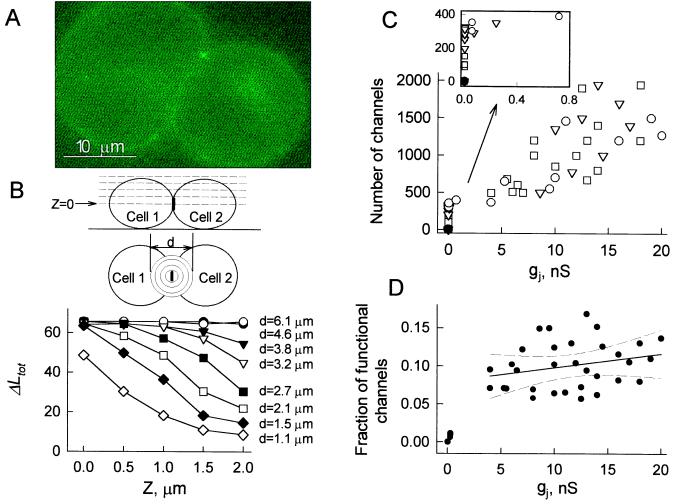
Communication-incompetent cell lines were transfected with connexin (Cx) 43 fused with enhanced green fluorescent protein (EGFP) to examine the relation between Cx distribution determined by fluorescence microscopy and electrical coupling measured at single-channel resolution in living cell pairs. Cx43-EGFP channel properties were like those of wild-type Cx43 except for reduced sensitivity to transjunctional voltage. Cx43-EGFP clustered into plaques at locations of cell-cell contact. Coupling was always absent in the absence of plaques and even in the presence of small plaques. Plaques exceeding several hundred channels always conferred coupling, but only a small fraction of channels were functional. These data indicate that clustering may be a requirement for opening of gap junction channels.


Figures

Figure 1
Figure 1
Cx43–EGFP fluorescence forms junctional plaques correlated with electrical coupling and dye transfer. (A) N2A cell pair showing only diffuse Cx43–EGFP fluorescence staining in appositional and other membrane areas (Left) was not electrically coupled (Right). Voltage steps applied to one cell (transjunctional voltage, Vj, Lower trace) produced no changes in junctional current (Ij) recorded in the unstepped cell. (B) A cell pair showing two junctional plaques and diffuse membrane staining elsewhere (Left, fluorescent and phase-contrast images) was electrically coupled as indicated by the large changes in Ij in response to an applied Vj. Coupling conductance was ≈12 nS. (C and D) Electrically coupled HeLa cells containing Cx43–EGFP plaques show Lucifer Yellow and DAPI cell–cell transfer. (Left) Phase. (Center) Fluorescence before dye injection. (Right) After dye injection. (C) A cluster of three cells. Lucifer Yellow was injected into cell 2 and transferred to cell 1 but not cell 3. A large (arrow) and a small plaque could be seen between cells 1 and 2; gj = 15 nS. No plaques were evident between cells 2 and 3. The fluorescent image (taken 5 min after dye loading of cell 2) showed spread to cell 1 but not cell 2. (D) A cluster of three cells. DAPI was injected into cell 2 and transferred to cell 1 but not cell 3. Four junctional plaques could be seen between cell 1 and cell 3; gj = 40 nS; however, no plaques were seen with cell 2. The fluorescent image taken 14 min after dye loading of cell 3 showed labeling of the nuclei of cells 1 and 3 but not cell 2.
Figure 2
Figure 2
Voltage dependence of Cx43–EGFP GJs. (A) Junctional conductance depended on Vj. The solid line is a fit of the data to a Boltzmann equation of the form Gj = (1 − Gmin)/{1 + exp[A*(VjV0)]} + Gmin, where Gj is gj normalized to the maximum value, gmax, at Vj = 0; Gmin is the normalized residual gj; A is a measure of voltage sensitivity in mV−1; and V0 is the Vj at which Gj is halfway between the maximum and minimum values. The Boltzmann parameters were V0 = 81 ± 4 mV and A = 0.08 ± 0.02 mV−1, for positive Vj, and V0 = −82 ± 4 mV and A = 0.09 ± 0.02 mV−1, for negative Vj. Gmin was close to zero for both polarities of Vj. (B) An example of the slow time course with which Ij nears zero in response to a long-duration (2.5-min) Vj of −90 mV (HeLa cell pair). Repeated −20-mV Vj pulses, applied at 1-sec intervals before and after the long-duration Vj step, show a slow gj recovery. (C) Vj-induced gating of Cx43–EGFP GJs at the single-channel level in a HeLa cell pair that was coupled by nine functional channels. A Vj of −100 mV was applied for a duration of 60 sec. Seven transitions ≈110 pS in size were evident (see Inset histogram of Ij amplitude). There was no residual gj at the end of the Vj step. (D) Linearity of the IjVj relationship at the single-channel level. Vj ramps of ±100 mV and 2-sec duration were applied at regular intervals preceded by brief (200-msec) ±40-mV Vj steps. The arrow indicates spontaneous opening of a single Cx43–EGFP channel between a HeLa cell pair.
Figure 3
Figure 3
Fluorescence intensity reaches a plateau in the center of en face images of larger Cx43–EGFP plaques. Schematic drawings (Left) show orientations of the cell pairs and light paths for excitation (upward arrows) and emission (downward arrows). (A and B) Side-by-side and en face views of a Cx43–EGFP plaque in an N2A cell pair. (C) Two- and three-dimensional pseudocolor plots of fluorescence intensity in the square shown in B show a plateau in the central region of the plaque. (D) En face views of large and small plaques in a HeLa cell pair. (E) Plot of fluorescence intensity along the line shown in D crossing two of the three plaques. Fluorescence intensity is normalized to the average plateau value in the center of the largest plaque. Peak fluorescence was smaller in small plaques, but fall-off at edges was about the same. Pseudocolor in C and D was adjusted to maximize the range of fluorescence intensity.
Figure 4
Figure 4
Relation between the size of Cx43–EGFP plaques and gj. Data are summarized from N2A, HeLa, and RIN cell pairs with single plaques. (A) Side-by-side view of an N2A cell pair containing a single junctional plaque ≈0.3 μm in diameter. gj in this cell pair was 230 pS, which corresponds to two functional channels. (B) Examination of the effect of focus (z-axis position) and size of the region of interest (ROI) used to measure fluorescence on the total measured fluorescence (Ltot). Diagrams of a cell pair containing a single plaque (thick vertical bar) illustrate the experimental procedures used. The Upper drawing is a side view, in which the solid horizontal line represents the coverslip and the dashed horizontal lines represent different z-axis positions (z = 0 is the position giving the sharpest image of the plaque). The Lower drawing is the view as seen through the microscope. The concentric circles represent ROIs of different diameters, d. Ltot as a function of z is plotted for ROIs of varying diameters (indicated to the right of each plot). The cell pair from which the data were obtained had a single plaque ≈1 μm in diameter. The objective was moved upward in 0.5-μm steps starting at z = 0. (C) Relation between the number of channels in a plaque and gj. Data were obtained from the three cell types: HeLa (circles), N2A (triangles), and RIN (squares). (Inset) An expanded view of data with gj between 0 and 0.8 nS is shown. gj was measured at small Vjs (<50 mV). (D) Plot of the calculated fraction of functional channels in a plaque vs. gj from the data presented in C. The solid line is a linear fit of the data for gjs exceeding 4 nS. The dashed lines represent 99% confidence intervals.

Similar articles

Cited by

References

    1. Willecke K, Hennemann H, Dahl E, Jungbluth S, Heynkes R. Eur J Cell Biol. 1991;56:1–7. - PubMed
    1. Goodenough D A, Goliger J A, Paul D L. Annu Rev Biochem. 1996;65:475–502. - PubMed
    1. Bergoffen J, Scherer S S, Wang S, Scott M O, Bone L J, Paul D L, Chen K, Lensch M W, Chance P F, Fischbeck K H. Science. 1993;262:2039–2042. - PubMed
    1. Ionasescu V, Searby C, Ionasescu R. Hum Mol Genet. 1994;3:355–358. - PubMed
    1. Kelsell D P, Dunlop J, Stevens H P, Lench N J, Liang J N, Parry G, Mueller R F, Leigh I M. Nature (London) 1997;387:80–83. - PubMed

Publication types

LinkOut - more resources