

Review
doi: 10.1136/bmj.320.7236.698.
ABC of arterial and venous disease. Non-invasive methods of arterial and venous assessment
- PMID: 10710584
- PMCID: PMC1117713
- DOI: 10.1136/bmj.320.7236.698
Item in Clipboard
Review
ABC of arterial and venous disease. Non-invasive methods of arterial and venous assessment
BMJ.
.
No abstract available
Figures
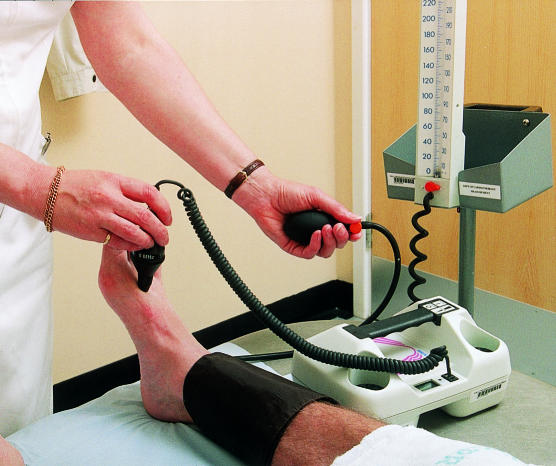
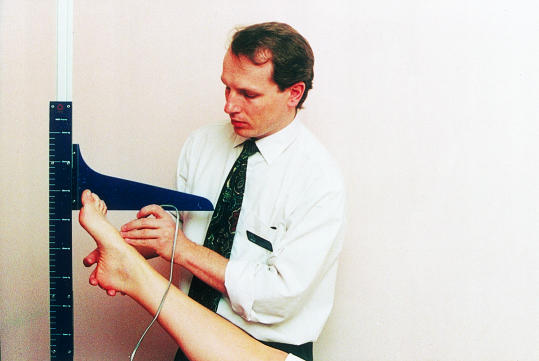
Handheld pencil Doppler being used to measure ankle brachial pressure index
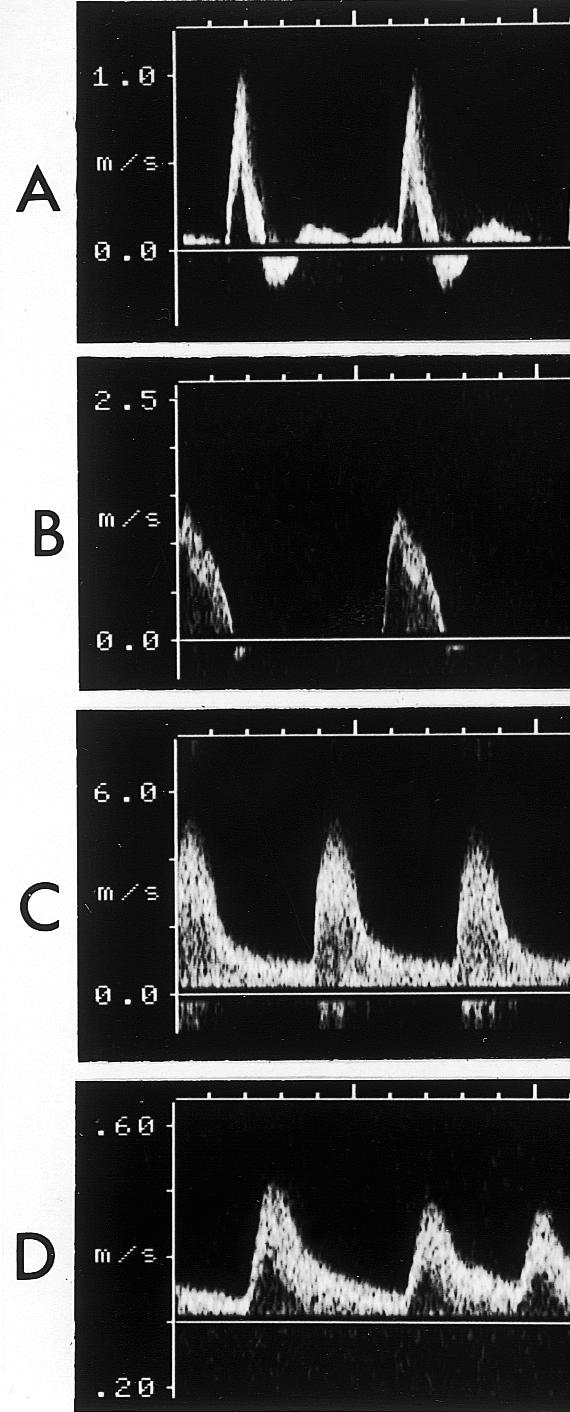
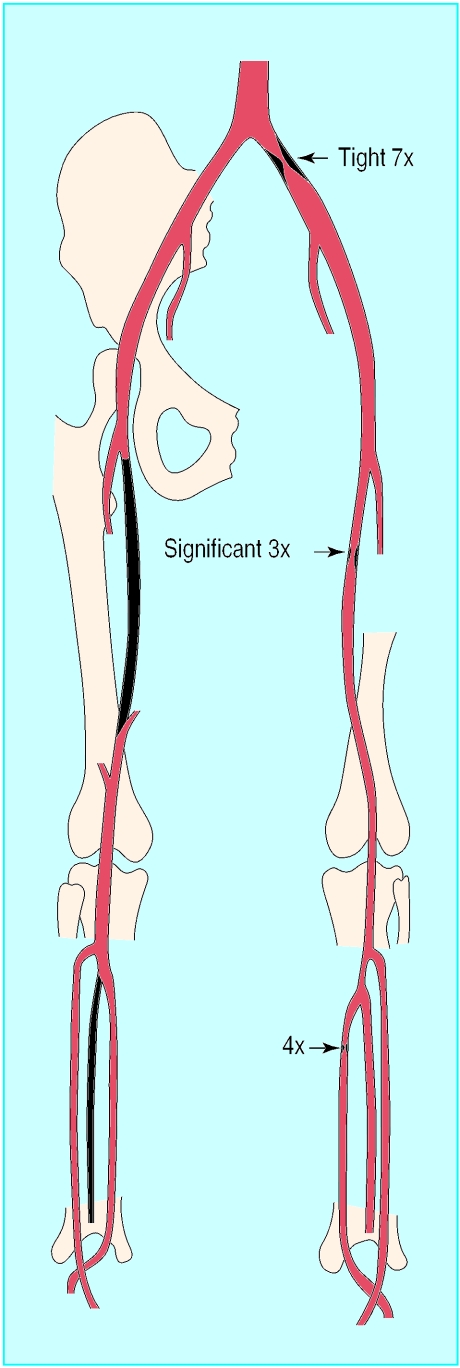
Left: Doppler velocity waveforms: (a) triphasic waveform in normal artery; (b) biphasic waveform, with increased velocity, through a mild stenosis; (c) monophasic waveform, with greatly increased velocity, through tight stenosis; and (d) dampened monophasic waveform, with reduced velocity, recorded distal to tight stenosis. Right: Anatomical chart used to record position of stenoses, showing three stenoses with velocity increases of 7×, 4×, and 3× compared with adjacent unaffected arteries
Left: Doppler velocity waveforms: (a) triphasic waveform in normal artery; (b) biphasic waveform, with increased velocity, through a mild stenosis; (c) monophasic waveform, with greatly increased velocity, through tight stenosis; and (d) dampened monophasic waveform, with reduced velocity, recorded distal to tight stenosis. Right: Anatomical chart used to record position of stenoses, showing three stenoses with velocity increases of 7×, 4×, and 3× compared with adjacent unaffected arteries
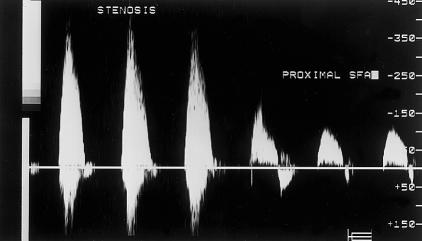
Spectral analysis of blood velocity in a stenosis, and unaffected area of proximal superficial femoral artery. The velocity increases from 150 to 300 m/s across the stenosis
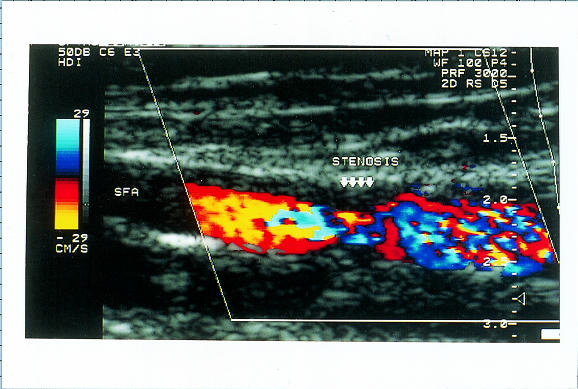
Colour duplex scanning of blood flow through stenosis of superficial femoral artery. Colour assignment (red or blue) depends on direction of blood flow and colour saturation reflects velocity of blood flow. Less saturation indicates regions of higher blood flow and deeper colours indicate slower flow; the absence of flow is coded as black
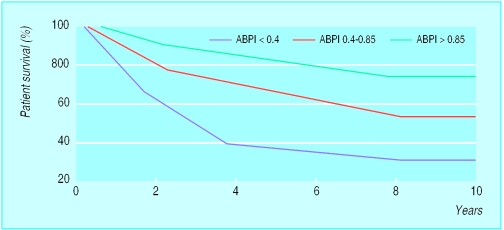
Patient survival according to measurements of ankle brachial pressure index (adapted from McKenna et al, Atherosclerosis 1991;87:119-28)
Pole test for measurement of ankle pressures in patients with calcified vessels: the Doppler probe is placed over a patent pedal artery and the foot raised against a pole that is calibrated in mm Hg. The point at which the pedal signal disappears is taken as the ankle pressure
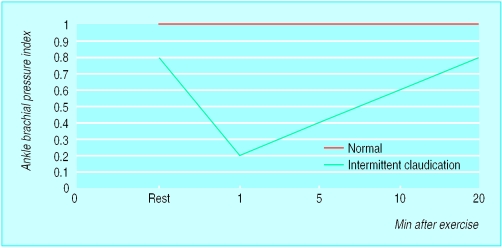
Fall in ankle brachial pressure index with exercise in patient with intermittent claudication and normal subject (adapted from Creager, Vasc Med 1997;2:231-7)
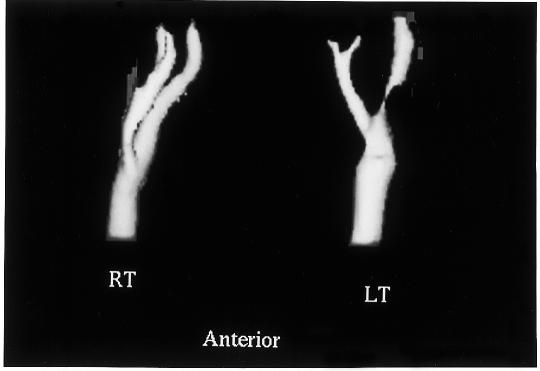
Spiral computed tomogram of both carotid systems showing a tight stenosis in the proximal segment of left internal carotid artery
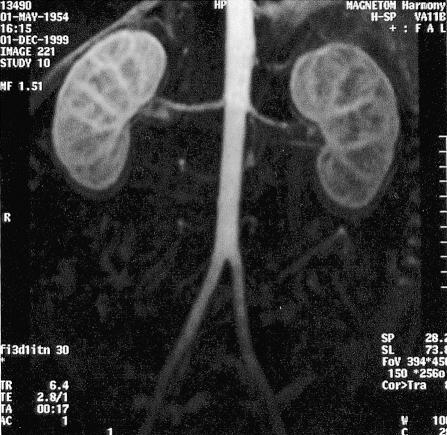
Magnetic resonance angiogram using an intravenous bolus of gadolinium contrast showing normal renal arteries
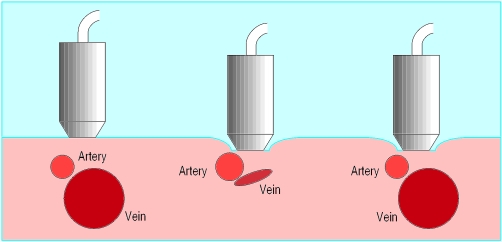
Ultrasound detection of deep vein thrombosis. The probe is held lightly on the skin and advanced along the course of the vein (left). Pressure is applied every few centimetres by compressing the transducer head against the skin. The vein collapses during compression if no thrombus is present (middle) but not if a deep vein thrombus is present (right)
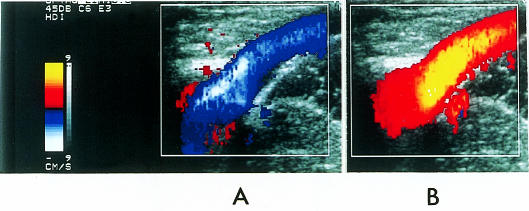
Colour duplex scanning of saphenopopliteal junction. The calf muscles are manually compressed producing upward flow in the vein (top), which appears as a blue colour for flow towards the heart (panel A). Sudden release of the distal compression causes reflux, seen as a red colour indicating flow away from the heart (panel B)
Colour duplex scanning of saphenopopliteal junction. The calf muscles are manually compressed producing upward flow in the vein (top), which appears as a blue colour for flow towards the heart (panel A). Sudden release of the distal compression causes reflux, seen as a red colour indicating flow away from the heart (panel B)
Publication types
MeSH terms
LinkOut - more resources
Full Text Sources
Medical