. 2000 Feb 1;522 Pt 3(Pt 3):375-90.
doi: 10.1111/j.1469-7793.2000.t01-2-00375.x.

Mitochondrial Ca2+ homeostasis during Ca2+ influx and Ca2+ release in gastric myocytes from Bufo marinus

Affiliations

Mitochondrial Ca2+ homeostasis during Ca2+ influx and Ca2+ release in gastric myocytes from Bufo marinus

R M Drummond et al. J Physiol. .

Abstract

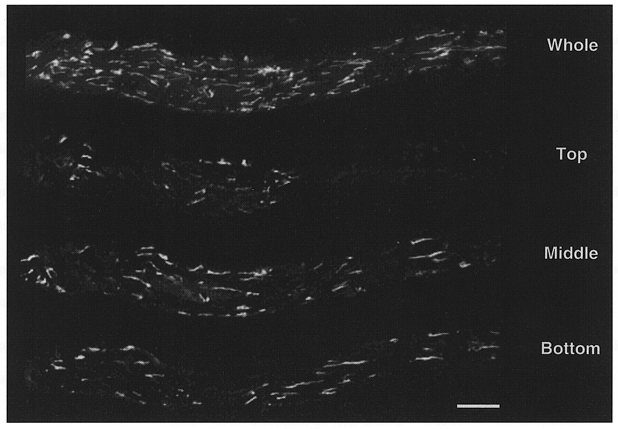
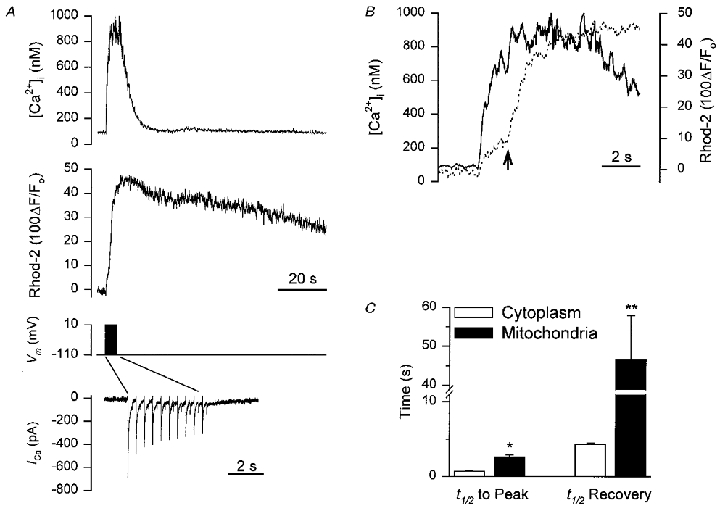
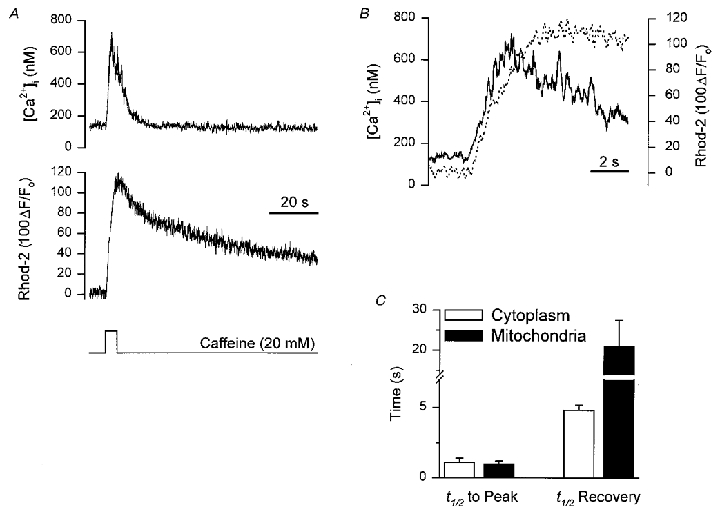
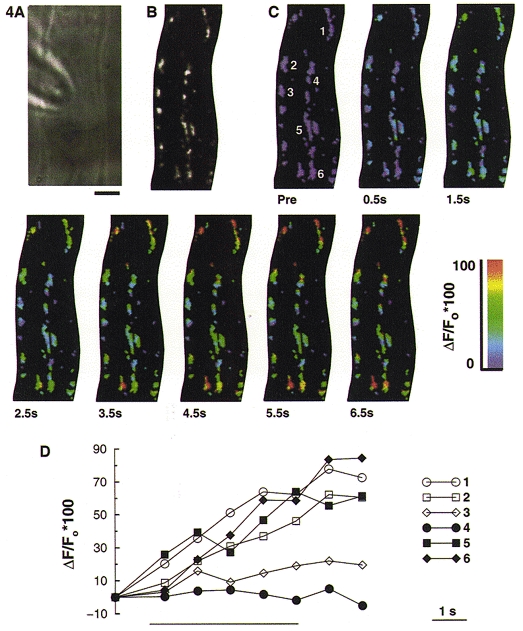
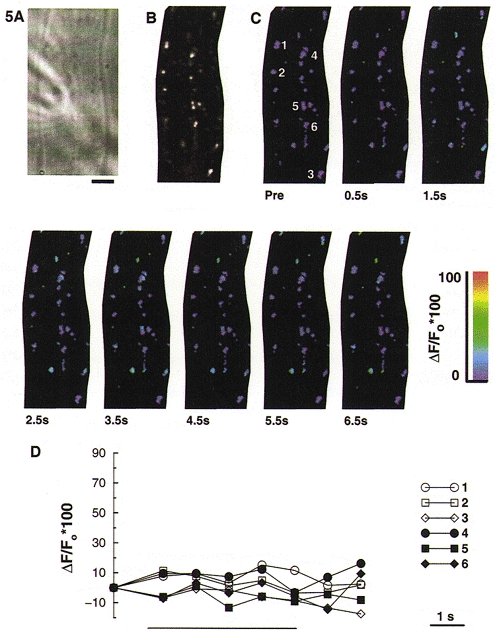
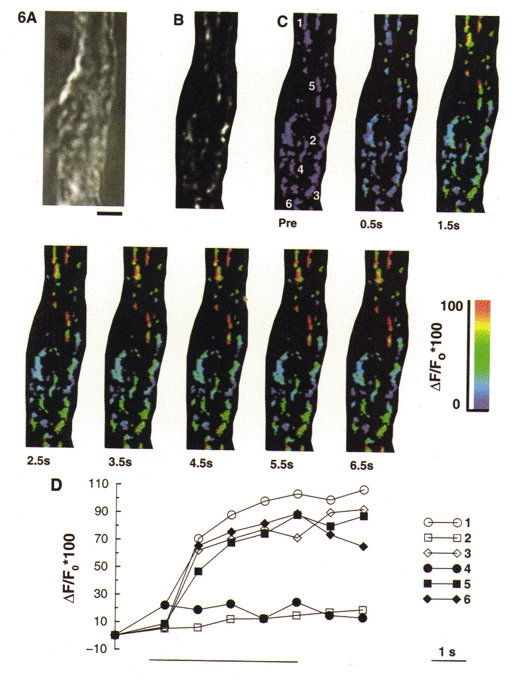
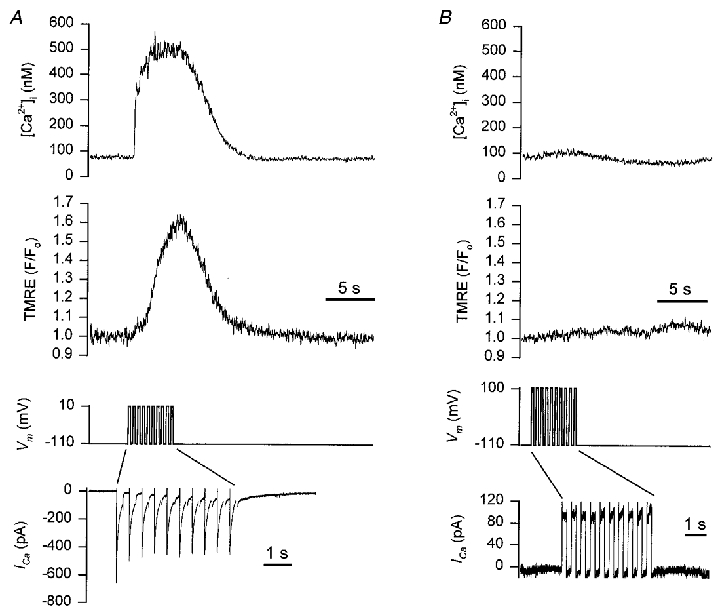
1. The Ca(2+)-sensitive fluorescent indicator rhod-2 was used to monitor mitochondrial Ca2+ concentration ([Ca2+]m) in gastric smooth muscle cells from Bufo marinus. In some studies, fura-2 was used in combination with rhod-2, allowing simultaneous measurement of cytoplasmic Ca2+ concentration ([Ca2+]i) and [Ca2+]m, respectively. 2. During a short train of depolarizations, which causes Ca2+ influx from the extracellular medium, there was an increase in both [Ca2+]i and [Ca2+]m. The half-time (t1/2) to peak for the increase in [Ca2+]m was considerably longer than the t1/2 to peak for the increase in [Ca2+]i. [Ca2+]m remained elevated for tens of seconds after [Ca2+]i had returned to its resting value. 3. Stimulation with caffeine, which causes release of Ca2+ from the sarcoplasmic reticulum (SR), also produced increases in both [Ca2+]i and [Ca2+]m. The values of t1/2 to peak for the increase in [Ca2+] in both cytoplasm and mitochondria were similar; however, [Ca2+]i returned to baseline values much faster than [Ca2+]m. 4. Using a wide-field digital imaging microscope, changes in [Ca2+]m were monitored within individual mitochondria in situ, during stimulation of Ca2+ influx or Ca2+ release from the SR. 5. Mitochondrial Ca2+ uptake during depolarizing stimulation caused depolarization of the mitochondrial membrane potential. The mitochondrial membrane potential recovered considerably faster than the recovery of [Ca2+]m. 6. This study shows that Ca2+ influx from the extracellular medium and Ca2+ release from the SR are capable of increasing [Ca2+]m in smooth muscle cells. The efflux of Ca2+ from the mitochondria is a slow process and appears to be dependent upon the amount of Ca2+ in the SR.


Figures

Figure 1
Figure 1. Mitochondria in a Bufo marinus gastric myocyte labelled with rhod-2
Smooth muscle cells were loaded with 1–1.5 μM rhod-2 AM for 1 h. The positive charge on rhod-2 AM results in significant accumulation of this indicator within the mitochondrial matrix. Following hydrolysis of the acetoxymethylester group, rhod-2 becomes trapped in the mitochondrial matrix. The image showing the whole cell reflects a maximum intensity projection of the entire through-focus data set. The images labelled top, middle and bottom reflect 0.25 μm optical sections from the respective locations within the cell. The cell was imaged using a digital imaging microscope (Moore et al. 1993) and processed using a constrained deconvolution algorithm (Carrington et al. 1990). Scale bar represents 10 μm.
Figure 2
Figure 2. Simultaneous measurement of cytoplasmic and mitochondrial [Ca2+] during depolarizing stimulation
Smooth muscle cells were loaded with 1–1.5 μM rhod-2 AM for 1 h to enable monitoring of [Ca2+]m and fura-2 was included in the patch pipette to allow simultaneous monitoring of [Ca2+]i. A, representative recording showing: top trace, the [Ca2+]i transient during a 5 s train of depolarizing pulses (from −110 to +10 mV, 250 ms duration, 2 Hz); middle trace, the corresponding change in [Ca2+]m during the depolarizing train; bottom traces show the membrane potential and the membrane current, during the depolarizing train. Note the change in time scale for the membrane current. B, overlay of [Ca2+]i and [Ca2+]m records from A re-plotted on an expanded time scale (continuous line, [Ca2+]i; dashed line, [Ca2+]m). Arrow indicates the secondary increase in the rate of mitochondrial Ca2+ uptake which occurs approximately 2 s after initiating the depolarizing train. C, summary data of the half-time (t½) to peak for the increase in [Ca2+]i and [Ca2+]m and also the t½ for the recovery of [Ca2+]i and [Ca2+]m (n= 9). *P < 0.003, **P < 0.006.
Figure 3
Figure 3. Simultaneous measurement of cytoplasmic and mitochondrial [Ca2+] during caffeine-induced release of Ca2+ from the SR
Smooth muscle cells were loaded with 1–1.5 μM rhod-2 AM for 1 h to enable monitoring of [Ca2+]m and fura-2 was included in the patch pipette to allow simultaneous monitoring of [Ca2+]i. A, representative recording showing: top trace, the [Ca2+]i transient in response to a 5 s application of caffeine (20 mM); middle trace, the corresponding change in [Ca2+]m during the stimulation with caffeine; bottom trace the period of caffeine application. B, overlay of [Ca2+]i and [Ca2+]m records from A re-plotted on an expanded time scale (continuous line, [Ca2+]i; dashed line, [Ca2+]m). C, summary data of the t½ to peak for the increase in [Ca2+]i and [Ca2+]m and also the t½ for the recovery of [Ca2+]i and [Ca2+]m (n= 6).
Figure 4
Figure 4. Subcellular imaging of the increase in mitochondrial [Ca2+] during depolarizing stimulation
Smooth muscle cells were loaded with 1–1.5 μM rhod-2 AM for 1 h to enable monitoring of [Ca2+]m. A, bright field image of a Bufo marinus gastric smooth muscle cell from which the subsequent fluorescence images in this figure were obtained. Scale bar represents 5 μm and is applicable to all the images shown. B, grey scale image of rhod-2 labelled mitochondria. The image represents a 1.5 μm thick optical section from the through-focus data set, which has been processed using a constrained deconvolution algorithm (Carrington et al. 1990). C, shown in pseudocolour is the increase in [Ca2+]m, for the same optical section as in B, during a 5 s depolarizing train (from −110 to +10 mV, 250 ms duration, 2 Hz). ‘Pre’ indicates the image acquired before applying the depolarizing train. Thereafter, through-focus image sets were acquired every 1 s for the next 10 s, commencing 0.5 s after the beginning of the depolarizing train. D, rhod-2 fluorescence for the six individual mitochondria numbered in the first image of C, selected from regions close to the membrane (open symbols) or more centrally located (filled symbols), in the 3-D data set. Each mitochondrion is represented by the fluorescence of its brightest pixel, and was normalized to the pre-stimulation value. The bar beneath the graph indicates the period of depolarizing stimulation.
Figure 5
Figure 5. FCCP blocks the increase in mitochondrial [Ca2+] during depolarizing stimulation
Smooth muscle cells were loaded with 1–1.5 μM rhod-2 AM for 1 h to enable monitoring of [Ca2+]m. A, bright field image of a Bufo marinus gastric smooth muscle cell from which the subsequent fluorescence images in this figure were obtained. Scale bar represents 5 μm and is applicable to all the images shown. B, grey scale image of rhod-2 labelled mitochondria. This image represents a 1.5 μm thick optical section of the through-focus data set. FCCP (1 μM) was applied to the cell approximately 3 min prior to delivering the depolarizing train. C, pseudocolour images of the same optical section as shown in B during a 5 s depolarizing train (from −110 to +10 mV, 250 ms duration, 2 Hz). ‘Pre’ indicates the image acquired before applying the depolarizing train. D, rhod-2 fluorescence for the six individual mitochondria numbered in the first image of C, selected from regions close to the membrane (open symbols) or more centrally located (filled symbols). Each mitochondrion is represented by the fluorescence of its brightest pixel, and was normalized to the pre-stimulation value. The bar beneath the graph indicates the period of depolarizing stimulation.
Figure 6
Figure 6. Subcellular imaging of the increase in mitochondrial [Ca2+] during caffeine-induced release of Ca2+ from the SR
Smooth muscle cells were loaded with 1–1.5 μM rhod-2 AM for 1 h to enable monitoring of [Ca2+]m. A, bright field image of a Bufo marinus gastric smooth muscle cell from which the subsequent fluorescence images in this figure were obtained. Scale bar represents 5 μm and is applicable to all the images shown. B, grey scale image of rhod-2 labelled mitochondria. This image represents a 1.5 μm thick optical section of the through-focus data set. C, pseudocolour images of the same optical section as shown in B during a 5 s application of caffeine (20 mM). ‘Pre’ indicates the image acquired before application of caffeine. D, rhod-2 fluorescence for the six individual mitochondria numbered in the first image of C, selected from regions close to the membrane (open symbols) or more centrally located (filled symbols). Each mitochondrion is represented by the fluorescence of its brightest pixel, and was normalized to the pre-stimulation value. The bar beneath the graph indicates the period of caffeine application.
Figure 7
Figure 7. Time course of depolarization- and caffeine-induced change in rhod-2 fluorescence
Smooth muscle cells were loaded with 1–1.5 μM rhod-2 AM for 1 h to enable monitoring of [Ca2+]m. Aa, time course of the change in mitochondrial rhod-2 fluorescence during a brief train of depolarizations. Approximately 20–30 mitochondria were selected in each cell and the brightest pixel was then followed through time (n= 7 cells, 159 mitochondria). The bar beneath the graph represents the period of depolarizing stimulation. Ab-d, histograms of the change in rhod-2 fluorescence at t= 5.5, 24.5 and 144.5 s for the depolarizing stimulus. Ba, time course of the change in mitochondrial rhod-2 fluorescence during a 5 s caffeine application. Approximately 20–30 mitochondria were selected in each cell and the brightest pixel was then followed through time (n= 5 cells, 115 mitochondria). The bar beneath the graph represents the period of caffeine stimulation. Bb-d, histograms of the change in rhod-2 fluorescence at t= 5.5, 24.5 and 144.5 s for stimulation with caffeine.
Figure 8
Figure 8. Simultaneous measurement of cytoplasmic [Ca2+] and mitochondrial membrane potential during depolarizing stimulation
Smooth muscle cells were loaded with 100 nM TMRE for 10 min to enable monitoring of the mitochondrial membrane potential. Fura-2 was included in the patch pipette to allow simultaneous monitoring of [Ca2+]i. A, representative recording showing: top trace, the [Ca2+]i transient during a 5 s train of depolarizing pulses (from −110 to +10 mV, 250 ms duration, 2 Hz); middle trace, the corresponding change in mitochondrial membrane potential. An increase in TMRE fluorescence signals depolarization of the mitochondrial membrane potential; bottom traces show the membrane potential and the membrane current, during the depolarizing train. Note the change in the time scale for the membrane current. B, the same cell as shown in A, with the membrane potential in this sequence pulsed to +100 mV during the depolarizing train.

Similar articles

Cited by

References

    1. Babcock DF, Herrington J, Goodwin PC, Park YB, Hille B. Mitochondrial participation in the intracellular Ca2+ network. Journal of Cell Biology. 1997;136:833–844. - PMC - PubMed
    1. Bassani JW, Bassani RA, Bers DM. Ca2+ cycling between sarcoplasmic reticulum and mitochondria in rabbit cardiac myocytes. The Journal of Physiology. 1993;460:603–621. - PMC - PubMed
    1. Bassani RA, Bassani JWM, Bers DM. Mitochondrial and sarcolemmal Ca2+ transport reduce [Ca2+]i during caffeine contractures in rabbit cardiac myocytes. The Journal of Physiology. 1992;453:591–608. - PMC - PubMed
    1. Benham CD, Tsien RW. A novel receptor-operated Ca2+-permeable channel activated by ATP in smooth muscle. Nature. 1987;328:275–278. - PubMed
    1. Berridge MJ. Inositol trisphosphate and calcium signalling. Nature. 1993;361:315–325. - PubMed

Publication types

MeSH terms

LinkOut - more resources