. 2000 Mar 28;97(7):3753-8.
doi: 10.1073/pnas.97.7.3753.

The molecular basis of vernalization: the central role of FLOWERING LOCUS C (FLC)

Affiliations

The molecular basis of vernalization: the central role of FLOWERING LOCUS C (FLC)

C C Sheldon et al. Proc Natl Acad Sci U S A. .

Abstract

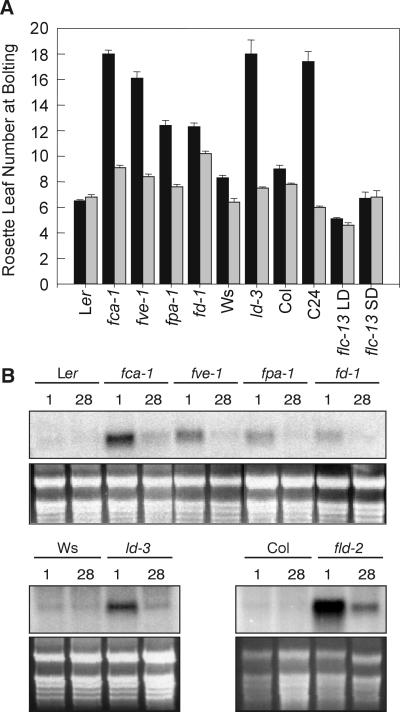
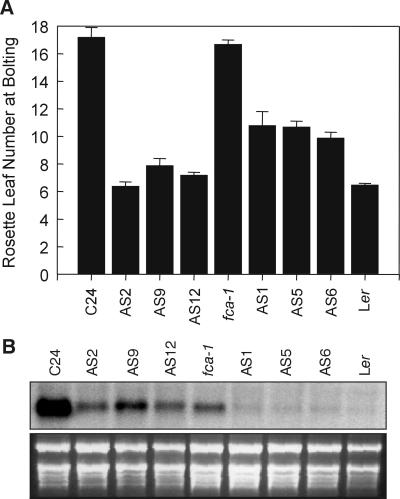
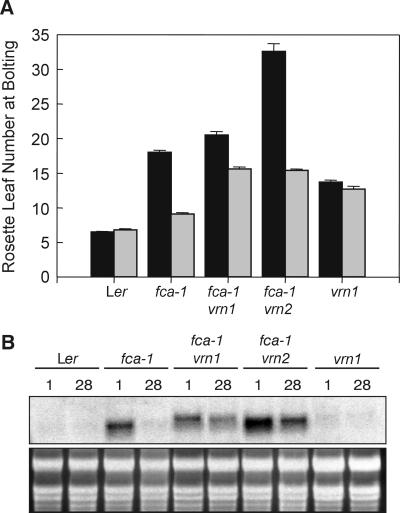
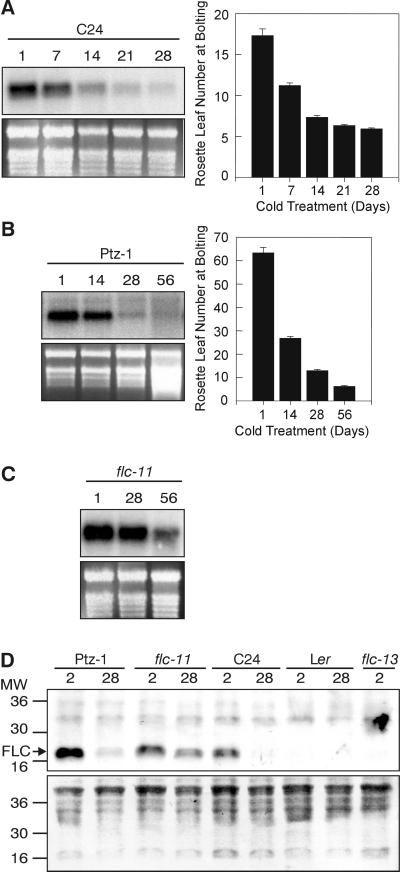
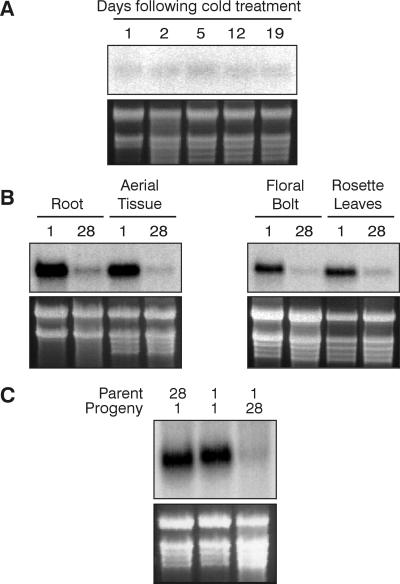
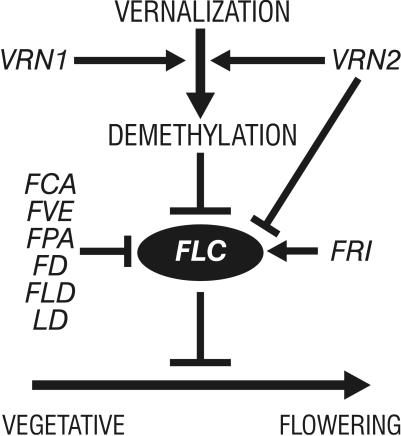
In Arabidopsis, the MADS-box protein encoded by FLOWERING LOCUS C (FLC) is a repressor of flowering. Vernalization, which promotes flowering in the late-flowering ecotypes and many late-flowering mutants, decreases the level of FLC transcript and protein in the plant. This vernalization-induced reduction in FLC transcript levels is mitotically stable and occurs in all tissues. FLC activity is restored in each generation, as is the requirement of a low-temperature exposure for the promotion of flowering. The level of FLC determines the extent of the vernalization response in the promotion of flowering, and there is a quantitative relationship between the duration of cold treatment and the extent of down-regulation of FLC activity. We conclude that FLC is the central regulator of the induction of flowering by vernalization. Other vernalization-responsive late-flowering mutants, which are disrupted in genes that encode regulators of FLC, are late-flowering as a consequence of their elevated levels of FLC.


Figures

Figure 1
Figure 1
Vernalization decreases both flowering time and FLC transcript level in vernalization-responsive late-flowering mutants. (A) Flowering time expressed as rosette leaf number for mutants and their corresponding wild types, fca-1, fve-1, fpa-1, and fd-1 in Ler; ld-3 in Ws-2; and flc-13 in C24, cold-treated for either 1 (black bars) or 28 (gray bars) days. The flc-13 mutant was grown under both a 16-h photoperiod (LD) and an 8-h photoperiod (SD). One-day cold-treated fld-2 plants remained vegetative throughout the experiment (terminated on day 90); fld-2 plants that had been cold-treated for 28 days flowered with an average of 14.7 ± 0.4 rosette leaves. These data are not included, but the data for the wild-type Col are. The error bars represent the SE. (B) FLC expression in seedlings of Ler, fca-1, fve-1, fpa-1, fd-1, Ws-2, ld-3, Col, and fld-2, cold-treated for either 1 or 28 days, as indicated above the figure. The ethidium bromide-stained ribosomal bands are shown below the blots as loading controls.
Figure 2
Figure 2
Reduction in FLC transcript level caused by a 35S∷FLC antisense construct results in early-flowering in C24 and in the fca-1 mutant. (A) Flowering time of untransformed C24 and three C24 T2 lines (AS2, AS9, and AS12) containing the 35S∷FLC antisense construct, and of untransformed fca-1, three fca-1 T2 lines (AS1, AS5, and AS6), and Ler, expressed as rosette leaf number. Error bars represent the SE. (B) FLC expression in bolting, early-flowering T2 segregants and from bolting C24, fca-1, and Ler plants. The ethidium bromide-stained ribosomal bands are shown below the blots as loading controls.
Figure 3
Figure 3
Mutants with reduced responses to vernalization maintain a high FLC transcript level after cold treatment. (A) Flowering time expressed as rosette leaf number for Ler, fca-1, fca-1 vrn1–1, fca-1 vrn2–1, and vrn1–1, cold-treated for either 1 (black bars) or 28 (gray bars) days. Error bars represent the SE. (B) FLC expression in seedlings of Ler and the mutants in A, cold-treated for either 1 or 28 days, as indicated above the figure. The ethidium bromide-stained ribosomal bands are shown below the blots as loading controls.
Figure 4
Figure 4
The down-regulation of FLC and the decrease in flowering time is proportional to the duration of the cold treatment. (A) FLC expression and flowering time, expressed as rosette leaf number, in C24 seedlings that were subjected to a cold pretreatment of 1, 7, 14, 21, or 28 days, as indicated, before growth at 21°C. Error bars represent the SE in A and B, and the ethidium bromide-stained ribosomal bands are shown as loading controls in A–C. (B) FLC expression and flowering time, expressed as rosette leaf number, in Ptz-1 seedlings that were subjected to a cold pretreatment of 1, 14, 28, or 56 days, as indicated, before growth at 21°C. (C) FLC expression in flc-11 seedlings that were subjected to a cold pretreatment of 1, 28, or 56 days, as indicated, before growth at 21°C. (D) FLC protein levels in the soluble fraction from Ptz-1, flc-11, C24, Ler, and flc-13 seedlings, cold-treated for either 2 or 28 days, as indicated. The amido black-stained filter is shown below as a loading control. The migration of the molecular weight markers (×1000) is shown to the left. A band detectable with the FLC antibody, but not with the preimmune serum, is indicated as FLC.
Figure 5
Figure 5
The down-regulation of FLC transcript by cold treatment is mitotically stable, but is reset in progeny. (A) FLC expression in 28-day cold-treated C24, harvested after 1, 2, 5, 12, or 19 days of growth at 21°C, as indicated above the figure. The majority of the plants were bolting at 19 days. (B) FLC expression in tissues of 1- and 28-day cold-treated C24 plants. Root and aerial tissue were from one set of seedlings, and floral bolts (2–3 cm in height) and rosette leaves were derived from another set of plants. (C) FLC expression in C24 seedlings that were the progeny of plants that were either cold-treated for 28 days (lane 1) or for 1 day (lanes 2 and 3), which, in turn, themselves were either cold-treated for 1 day (lanes 1 and 2) or for 28 days (lane 3). The ethidium bromide-stained ribosomal bands are shown below the blots as loading controls.
Figure 6
Figure 6
Model indicating the role of FLC in the transition to flowering and its regulation by vernalization, methylation, and genes involved in controlling flowering time, based on data presented here and in refs. and . The down-regulation of FLC expression by demethylation may be direct or may be through a regulator of FLC.

References

    1. Sheldon C C, Burn J E, Perez P P, Metzger J, Edwards J A, Peacock W J, Dennis E S. Plant Cell. 1999;11:445–458. - PMC - PubMed
    1. Koornneef M, Blankestijn-de Vries H, Hanhart C, Soppe W, Peeters T. Plant J. 1994;6:911–919.
    1. Lee I, Michaels S D, Masshardt A S, Amasino R M. Plant J. 1994;6:903–909.
    1. Sanda S, Amasino R M. Weeds World. 1995;2:2–8.
    1. Michaels S D, Amasino R M. Plant Cell. 1999;11:949–956. - PMC - PubMed