

The dynamics of repeated elements: applications to the epidemiology of tuberculosis
- PMID: 10716736
- PMCID: PMC16274
- DOI: 10.1073/pnas.97.7.3532
The dynamics of repeated elements: applications to the epidemiology of tuberculosis
Abstract
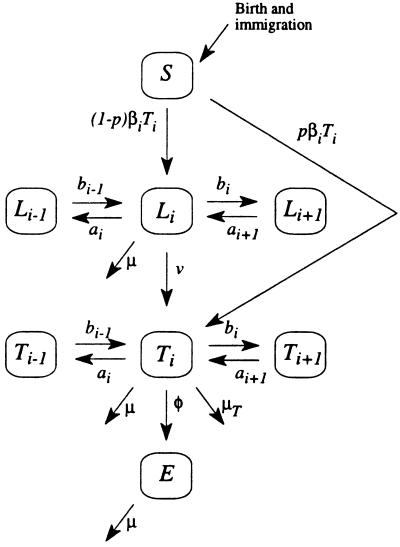
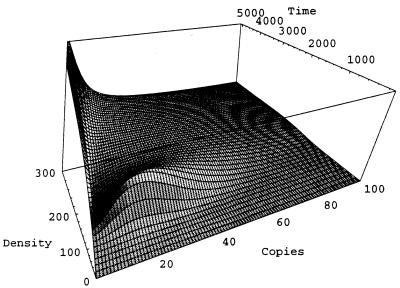
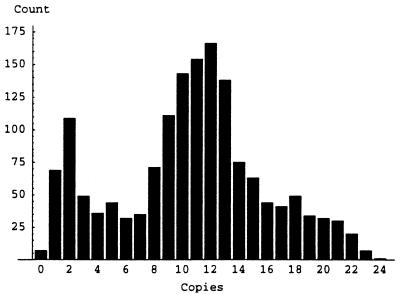
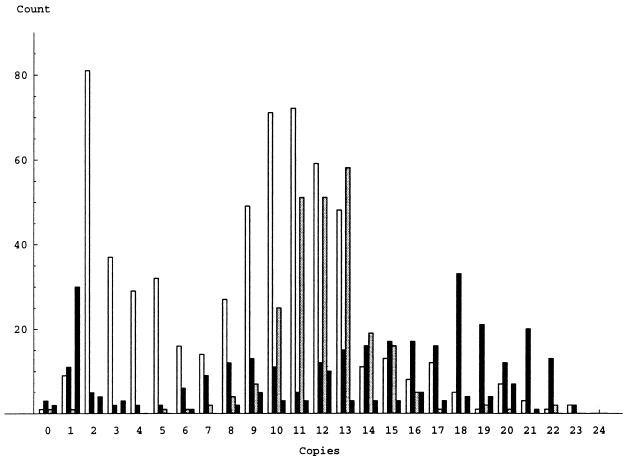
We propose a stepwise mutation model to describe the dynamics of DNA fingerprint variation in Mycobacterium tuberculosis. The genome of M. tuberculosis carries insertion sequences (IS6110) that are relatively stable over time periods of months but have an observable transposition rate over longer time scales. Variability in copy number and genomic location of (IS6110) can be harnessed to generate a DNA fingerprint for each strain, by digesting the genome with a restriction enzyme and using a portion of the element as a probe for Southern blots. The number of bands found for a given genome approximates the number of copies of IS6110 it carries. A large data set of such fingerprints from tuberculosis (TB) cases in San Francisco provides an observed distribution of IS6110 copy number. Implementation of the model through deterministic and stochastic simulation indicates some general features of IS/TB dynamics. By comparing observations with outcomes of the model, we conclude that the IS/TB system is very heterogeneous and far from equilibrium. We find that the transposition parameters have a much stronger effect than the epidemic parameters on copy number distribution.
Figures
References
-
- Paul R E L, Packer M J, Walmsley M, Lagog M, Ranford-Cartwright L C, Paru R, Day K P. Science. 1995;269:1709–1711. - PubMed
-
- Small P M, Hopewell P C, Singh S P, Paz A, Parsonnet J, Ruston D C, Schecter G F, Daley C L, Schoolnik G K. N Engl J Med. 1994;330:1703–1709. - PubMed
-
- Small P M, Shafer R W, Hopewell P C, Singh S P, Murphy M J, Desmond E, Sierra M F, Schoolnik G K. N Engl J Med. 1993;328:1137–1144. - PubMed
-
- Daley C L, Small P M, Schecter G F, Schoolnik G K, McAdam R A, Jacobs W R, Hopewell P C. N Engl J Med. 1992;326:231–235. - PubMed
-
- Porco T C, Blower S. Theor Popul Biol. 1998;54:117–132. - PubMed
Publication types
MeSH terms
Grants and funding
LinkOut - more resources
Full Text Sources
Medical
