. 2000 Mar 1;14(5):521-35.

The MAR-binding protein SATB1 orchestrates temporal and spatial expression of multiple genes during T-cell development

Affiliations

The MAR-binding protein SATB1 orchestrates temporal and spatial expression of multiple genes during T-cell development

J D Alvarez et al. Genes Dev. .

Abstract

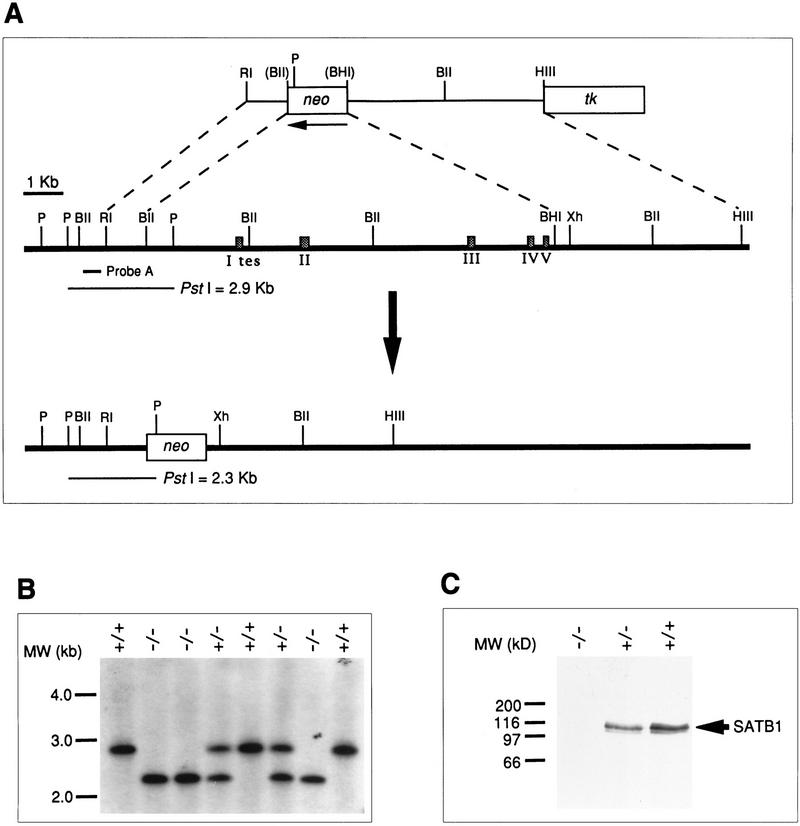
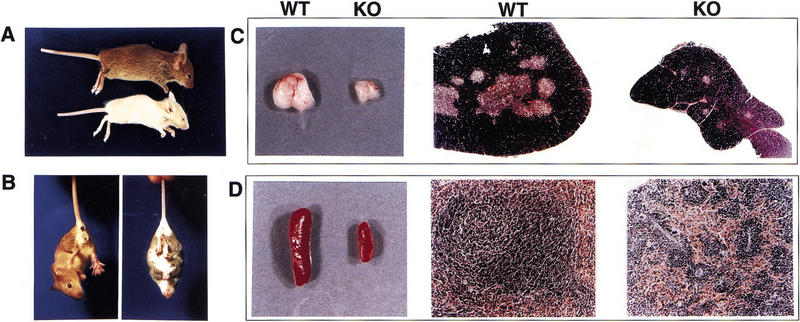
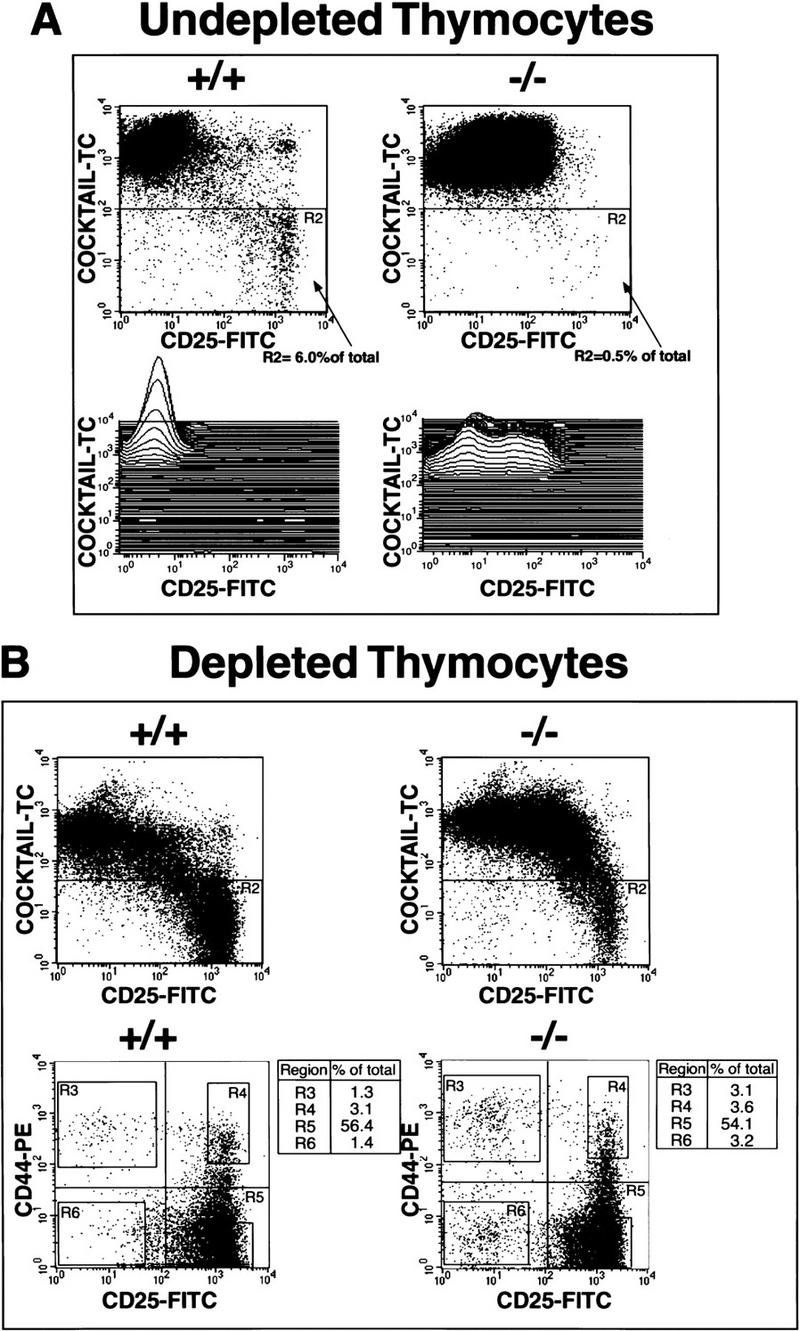
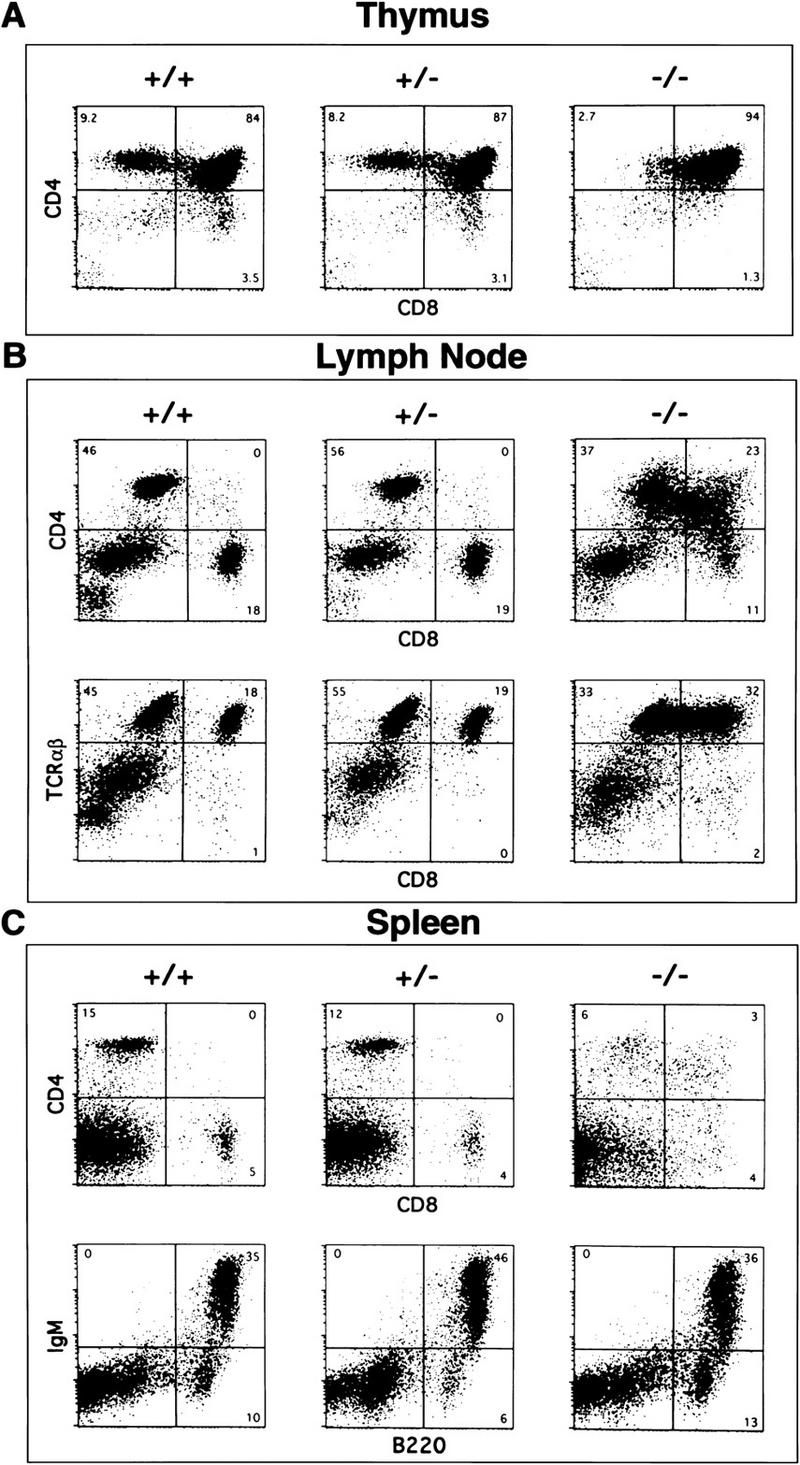
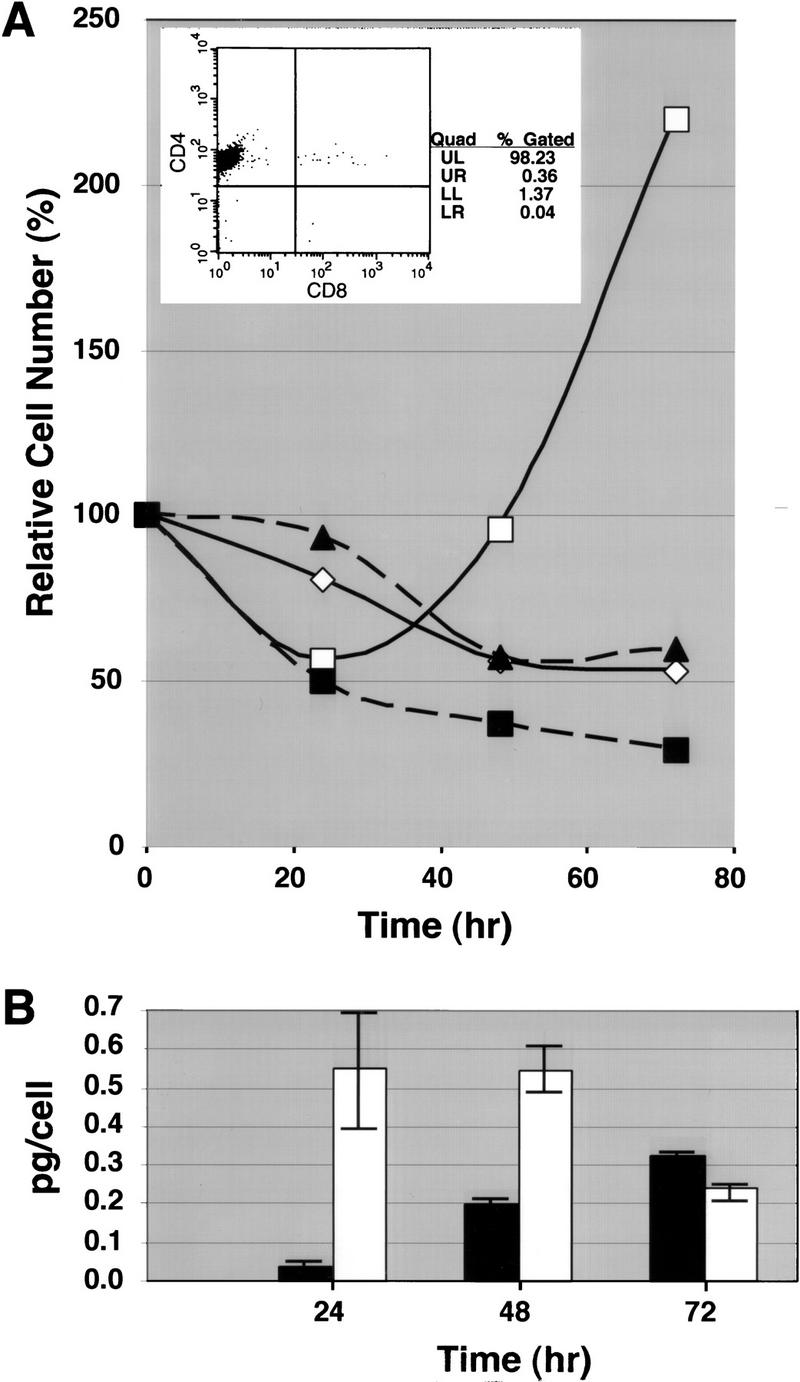
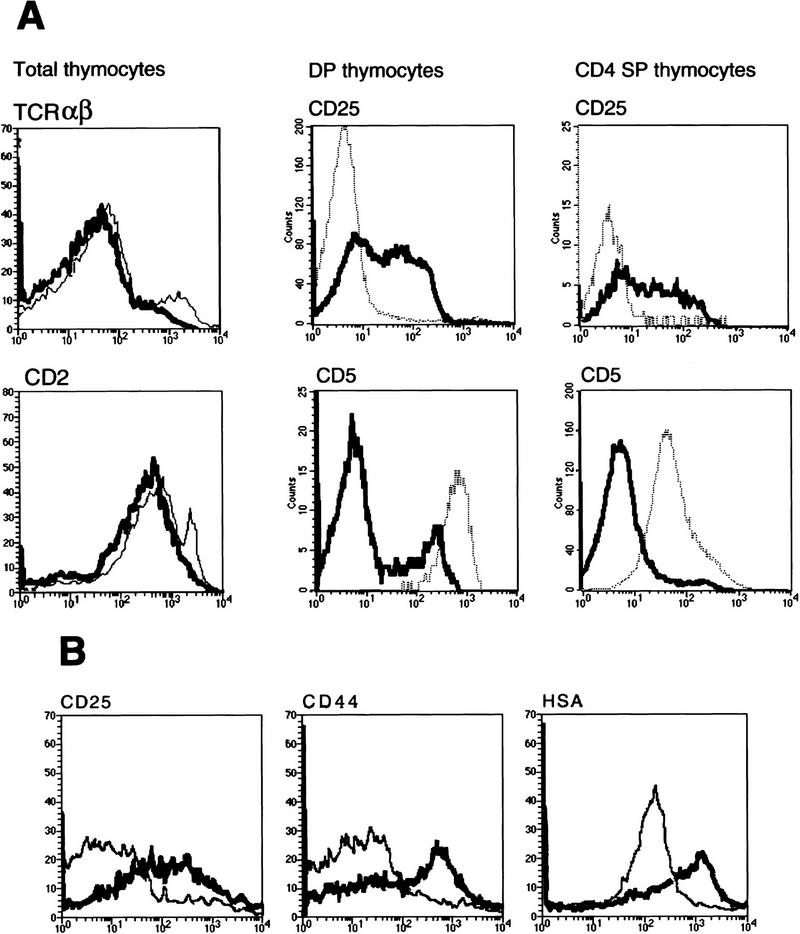
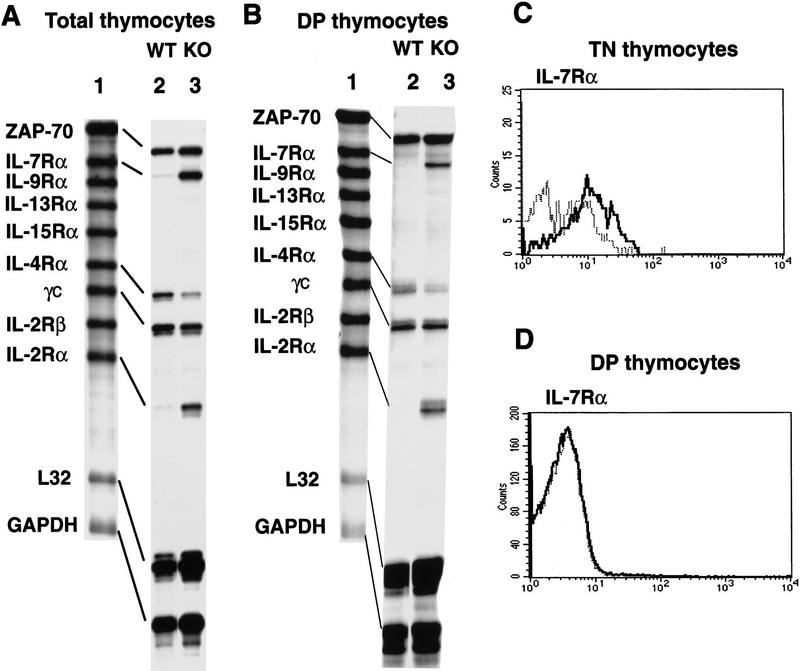
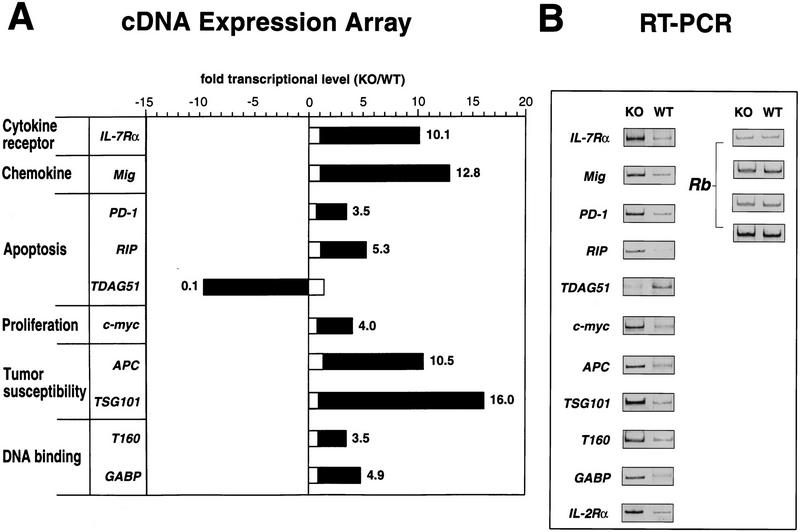
SATB1 is expressed primarily in thymocytes and can act as a transcriptional repressor. SATB1 binds in vivo to the matrix attachment regions (MARs) of DNA, which are implicated in the loop domain organization of chromatin. The role of MAR-binding proteins in specific cell lineages is unknown. We generated SATB1-null mice to determine how SATB1 functions in the T-cell lineage. SATB1-null mice are small in size, have disproportionately small thymi and spleens, and die at 3 weeks of age. At the cellular level, multiple defects in T-cell development were observed. Immature CD3(-)CD4(-)CD8(-) triple negative (TN) thymocytes were greatly reduced in number, and thymocyte development was blocked mainly at the DP stage. The few peripheral CD4(+) single positive (SP) cells underwent apoptosis and failed to proliferate in response to activating stimuli. At the molecular level, among 589 genes examined, at least 2% of genes including a proto-oncogene, cytokine receptor genes, and apoptosis-related genes were derepressed at inappropriate stages of T-cell development in SATB1-null mice. For example, IL-2Ralpha and IL-7Ralpha genes were ectopically transcribed in CD4(+)CD8(+) double positive (DP) thymocytes. SATB1 appears to orchestrate the temporal and spatial expression of genes during T-cell development, thereby ensuring the proper development of this lineage. Our data provide the first evidence that MAR-binding proteins can act as global regulators of cell function in specific cell lineages.


Figures

Figure 1
Figure 1
Targeted disruption of the SATB1 gene. (A) Partial genomic structure of SATB1 and the targeting strategy. This deletion replaced the first five exons or 213 amino acids of the mouse thymus SATB1 (Nakagomi et al. 1994), including the translation start codon, with a neomycin-resistance gene. The recombined allele is shown at the bottom. Exons are indicated by shaded boxes. The nucleotide positions encompassed by coding exons are: exon 2, −34–211; exon 3, 212–388; exon 4, 389–515; exon 5, 516–639; exon 6, 640–752; exon 7, 753–1205; exon 8, 1206–N.D. (not determined). The exon labeled I tes encodes the 5′ UTR found in the human SATB1 cDNA isolated previously from testis (Dickinson et al. 1992). The corresponding 5′ UTR for the thymus cDNA has not yet been located. (P) PstI; (BII) BglII; (RI) EcoRI; (BHI) BamHI; (HIII) HindIII; and (Xh) XhoI. The map for PstI is incomplete. Restriction sites in parentheses were destroyed during construction of the targeting construct. (B) Southern blot of PstI-digested tail DNA from offspring of a heterozygous mating. Probe A (400 bp) was used for Southern blot analysis to detect both the wild-type 2.9-kb and mutant 2.3-kb PstI genomic fragments. (C) Western blot of protein lysates from 13-day-old thymi using anti-SATB1 antibody as described (Nakagomi et al. 1994). Symbols represent wild type (+/+) and heterozygous (+/−) and homozygous mutants (−/−).
Figure 2
Figure 2
Phenotype of the SATB1-null mice. (A) Shown are 22-day-old wild-type (WT; top) and knockout (KO; bottom) littermates demonstrating a difference in size and ptosis of the eye. (B) A 26-day-old knockout mouse (right) displaying the clasping reflex in comparison with a wild-type littermate (left). The thymus (C) and spleen (D) from the SATB1-null mouse shown in A are smaller than that of the wild-type littermate. These organs were fixed in formalin and embedded in paraffin. Hematoxylin- and eosin-stained sections revealed that the SATB1-null thymus (top right of C) has a higher cortex (purple) to medulla (pink) ratio than the wild-type thymus (top middle of C) at a 40× magnification. The SATB1-null spleen (bottom right of D) has a significantly smaller white pulp (purple) compared with the wild-type spleen (bottom middle of D) visualized at the same magnification (100×).
Figure 3
Figure 3
A great reduction in TN thymocytes in SATB1-null thymi without changes in the ratio of specific TN subsets. (A) CD3CD4CD8 TN cells were quantified by incubation of total thymocytes with a combination of biotin-conjugated anti-CD3, anti-CD4, and anti-CD8 antibodies plus Tri-Color–streptavidin and FITC-conjugated anti-CD25 antibody and subjecting them to FACS analysis. SATB1-null thymus (−/−) (right) has only 1/10 the number of TN cells detected in a wild-type thymus (+/+) (left). A total of 200,000 events were collected. In each dot plot, 4 × 105 thymocytes are depicted. In SATB1-null thymocytes, there exists a Tri-Color-positive cell population that expresses an intermediate level of CD25 as shown by three-dimensional plot. In contrast, wild-type thymocytes have a well-defined population that is CD25 negative. (B) TN thymocytes were enriched by depletion of CD4- and CD8-expressing cells from total thymocytes. TN cell subsets from depleted thymocytes were purified further by gating out Tri-Color-stained CD3-, CD4-, and CD8-positive T cells, B cells, granulocytes, dendritic cells, NK cells, and monocytes from thymocytes. The TN cell subsets in region R2 in the upper dot plots were subsequently subjected to FACScan analysis with PE-conjugated anti-CD44-antibody and FITC-conjugated anti-CD25 antibody. Again, the SATB1-null thymus contains significantly fewer CD25+ cells than wild-type thymus (cf. top right with top left dot plot); however, the subsets of CD25+ and CD44+ TN cells (bottom right) are represented in their normal proportions (bottom left dot plot). In the top dot plots, 2.5 × 104 events are depicted, in the bottom dot plots, 1 × 104 events are depicted. TN subsets in the order of development are R3 (CD25CD44+), R4 (CD25+CD44+), R5 (CD25+CD44), and R6 (CD25CD44). The percentage of each subset of the total cell population in the R2 region is shown in the table to the right of each dot plot.
Figure 4
Figure 4
Flow cytometric analysis of lymphocytes from wild-type, heterozygous, and knockout mice at 2 weeks of age. Data is representative of staining from at least four separate mice. Total number of cells collected for thymus in A is 2.7 × 108 +/−, 3.2 × 108 +/−, and 2.8 × 107 −/−, from lymph node in B is 1.4 × 106 +/+, 1.3 × 106 +/−, and 2.8 × 105 −/−, and for spleen in C is 9.1 × 107 +/+, 9.0 × 107 +/−, and 2.6 × 107 −/−. For each FACS analysis, 1 × 104 events are represented. In all cases, the FACS analysis of heterozygotes showed the same pattern as wild-type. (A) SATB1-null (−/−) thymus (right) contains few CD4+ or CD8+ SP cells compared with wild-type (+/+) and heterozygous (+/−) thymi (left and middle) (B) SATB1-null T cells in lymph nodes are greatly reduced in number and contain CD4+CD8+ DP as well as some CD4 SP cells (upper right). These cells express levels of TCRαβ (lower right) comparable to that of SP cells within wild-type and heterozygous lymph node cells (lower left and middle). (C) SATB1-null spleens have fewer T cells and lack distinct CD4+ and CD8+ populations (top right) compared with control wild-type and heterozygous spleens (top left and middle). B cell populations appear to be unaffected in SATB1-null spleen as assessed by IgM and B220 staining (bottom).
Figure 5
Figure 5
Apoptosis induced by PMA and ionomycin for SATB1-null peripheral CD4 SP cells. CD4 SP T cells were isolated from lymph nodes of control (C, either +/+ or +/−) and SATB1-null (KO) mice as described in Materials and Methods. The +/+ and +/− mice gave identical results. (A) The FACS profile of the purified CD4 SP cells from wild-type lymph nodes is shown in the inset. In each well of a 96-well culture plate, 3 × 104 cells were seeded and cultured in medium with or without PMA plus ionomycin. Cell number was determined at 24-, 48-, and 72-hr time points and the percentages of surviving cells are shown. The cell number did not vary >4% among the three samples. (▴) KO (med.); (█) KO (PMA+I); (⋄) C (med.); (□) C (PMA+I). (B) The IL-2 concentrations in the media were measured by ELISA assay at each time point after stimulation with PMA plus ionomycin. The IL-2 amounts per viable cell (pg/cell) are shown (the average values are shown by an open bar for control and a solid bar for KO CD4 SP T cells). The minimum and maximum pg/cell values obtained are indicated for each bar.
Figure 6
Figure 6
Dysregulated expression of certain developmental marker proteins in SATB1-null thymocytes and T cells. (A) Total thymocytes from wild-type and SATB1-null thymi were stained with a biotin-conjugated anti-CD2/Cy-chrome–streptavidin combination or Cy-Chrome-conjugated anti-TCRαβ antibody alone. CD5+ and CD25+ thymocytes in both CD4+ CD8+ DP and CD4+ SP populations were detected by PE-conjugated anti-CD8 antibody and biotin-conjugated anti-CD4 antibody/Tri-Color-streptavidin combined with either FITC-conjugated anti-CD5 antibody or FITC-conjugated anti-CD25 antibody. (B) Peripheral T cells from wild-type and SATB1-null lymph nodes were stained singly with FITC-conjugated anti-CD25 antibody, biotin-conjugated anti-CD44 antibody/Cy-Chrome–streptavidin, and biotin-conjugated anti-HSA antibody/Texas Red–streptavidin and analyzed by FACS. For histogram analysis, CD4CD8 double negative cells were excluded by gating. In all histograms the bold line represents the distribution of 1 × 104 stained T cells from SATB1-null mice while the staining distribution of T cells from control littermates is depicted by the curve with a narrow line.
Figure 7
Figure 7
Derepression of IL-2Rα and IL-7Rα genes in SATB1-null DP thymocytes. (A) RNA isolated from total thymocytes of SATB1-null and wild-type thymi were examined by a multi-probe RNase protection assay system containing a series of cytokine receptor probes. [32P]UTP-labeled antisense RNA probes (lane 1) were hybridized in excess to target total cellular RNA, after which free probe and other single-stranded RNAs were digested with RNase. The remaining RNase-protected probes derived from SATB1-null thymocytes (lane 2) and wild-type thymocytes (lane 3) were purified, and resolved on 6% denaturing polyacrylamide gels. (B) Identical to A except that target RNA was isolated from purified CD4+CD8+ DP cells by cell sorting using a PE-conjugated anti-CD8 antibody and an FITC-conjugated anti-CD4 antibody. (C) The CD3CD4CD8 TN cell subset from depleted thymocytes, as described in Fig. 3, were further purified by excluding Tri-Color-stained CD3-, CD4-, and CD8-positive T cells, B cells, granulocytes, dendritic cells, NK cells, and monocytes from thymocytes. The TN cell subset was subsequently subjected to FACS analysis with a PE-conjugated IL-7Rα antibody. (D) IL-7Rα+ cells in a CD4+CD8+ DP population were detected by a PE-conjugated anti-CD8 antibody and an FITC-conjugated anti-CD4 antibody with Cychrome–streptavidin combined with a biotin-conjugated anti-IL7Rα antibody. (C,D) (Bold line) SATB1 null mice; (narrow line) wild-type mice.
Figure 8
Figure 8
Dysregulation of multiple genes in SATB1-null thymocytes. (A) Genes that exhibited a >3.5-fold difference in their mRNA levels between SATB1-null and wild-type thymi based on Atlas mouse cDNA Expression Array and confirmed by RT–PCR are shown by solid bars. The ratio of these transcripts between knockout and wild-type liver are shown by open bars. (B) The RT–PCR results for these genes as well as IL-2Rα, which was not included in the expression array, are shown (see Materials and Methods). The Rb gene, which is expressed at a similar level in SATB1-null and wild-type thymocytes, was used as a control under varying RT–PCR conditions.

References

    1. Adams MD, Kerlavage AR, Fields C, Venter JC. 3,400 new expressed sequence tags identify diversity of transcripts in human brain. Nat Genet. 1993;4:256–267. - PubMed
    1. Agata Y, Kawasaki A, Nishimura H, Ishida Y, Tsubata T, Yagita H, Honjo T. Expression of the PD-1 antigen on the surface of stimulated mouse T and B lymphocytes. Int Immunol. 1996;8:765–772. - PubMed
    1. Banan M, Rojas IC, Lee W-H, King HL, Harriss JV, Kobayashi R, Webb CF, Gottlieb PD. Interaction of the nuclear matrix-associated region (MAR)-binding proteins, SATB1 and CDP/Cux, with a MAR element (L2a) in an upstream regulatory region of the mouse CD8a gene. J Biol Chem. 1997;272:18440–18452. - PubMed
    1. Beadling C, Johnson KW, Smith KA. Isolation of interleukin 2-induced immediate-early genes. Proc Natl Acad Sci. 1993;90:2719–2723. - PMC - PubMed
    1. Bode J, Kohwi Y, Dickinson L, Joh T, Klehr D, Mielke C, Kohwi-Shigematsu T. Biological significance of unwinding capability of nuclear matrix-associating DNAs. Science. 1992;255:195–197. - PubMed

Publication types

MeSH terms