. 2000 Mar 14;97(6):2680-5.
doi: 10.1073/pnas.97.6.2680.

Gene microarray identification of redox and mitochondrial elements that control resistance or sensitivity to apoptosis

Affiliations

Gene microarray identification of redox and mitochondrial elements that control resistance or sensitivity to apoptosis

D W Voehringer et al. Proc Natl Acad Sci U S A. .

Abstract

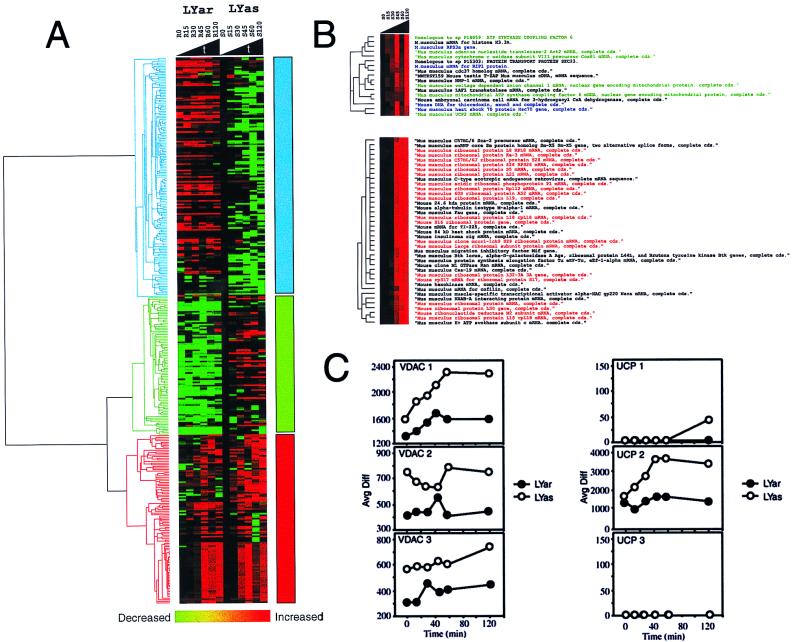
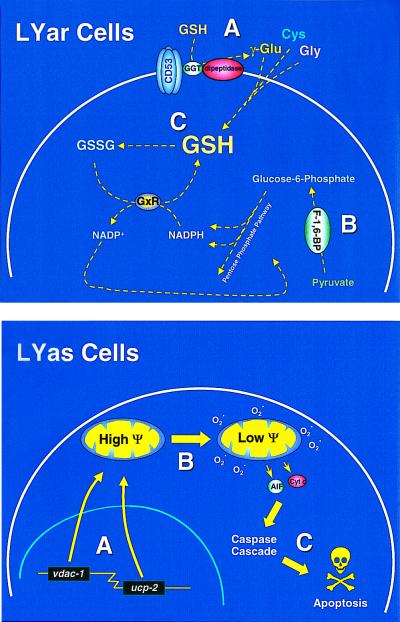
Multigenic programs controlling susceptibility to apoptosis in response to ionizing radiation have not yet been defined. Here, using DNA microarrays, we show gene expression patterns in an apoptosis-sensitive and apoptosis-resistant murine B cell lymphoma model system both before and after irradiation. From the 11,000 genes interrogated by the arrays, two major patterns emerged. First, before radiation exposure the radioresistant LYar cells expressed significantly greater levels of message for several genes involved in regulating intracellular redox potential. Compared with LYas cells, LYar cells express 20- to 50-fold more mRNA for the tetraspanin CD53 and for fructose-1,6-bisphosphatase. Expression of both of these genes can lead to the increase of total cellular glutathione, which is the principle intracellular antioxidant and has been shown to inhibit many forms of apoptosis. A second pattern emerged after radiation, when the apoptosis-sensitive LYas cells induced rapid expression of a unique cluster of genes characterized by their involvement in mitochondrial electron transport. Some of these genes have been previously recognized as proapoptotic; however others, such as uncoupling protein 2, were not previously known to be apoptotic regulatory proteins. From these observations we propose that a multigenic program for sensitivity to apoptosis involves induction of transcripts for genes participating in mitochondrial uncoupling and loss of membrane potential. This program triggers mitochondrial release of apoptogenic factors and induces the "caspase cascade." Conversely, cells resistant to apoptosis down-regulate these biochemical pathways, while activating pathways for establishment and maintenance of high intracellular redox potential by means of elevated glutathione.


Figures

Figure 1
Figure 1
Annexin staining of LYas and LYar cells after 5 Gy of irradiation. LYas and LYar cells were stained with annexin V protein at different intervals after irradiation to measure loss of membrane phosphatidylserine asymmetry, an indication of apoptosis. (Upper) Virtually no annexin V staining was detected in LYar cells before irradiation (thick black line), at 2 hr after irradiation (thin black line), or at 5 hr after irradiation (thick gray line). (Lower) A slight increase in annexin V staining could be detected in some LYas cells at 2 hr (thin black line) both with respect to LYar cells and with unirradiated LYas cells (thick black line). However, at 5 hr after irradiation (thick gray line), all the LYas cells stained positive for annexin V, compared with few LYar cells staining positive.
Figure 2
Figure 2
Scatter plots of gene expression for LYar and LYas cells after irradiation. Gene populations became apparent after gene expression levels in unirradiated cells were plotted against irradiated cells collected at indicated times (A–J). Gene induction in response to radiation is visualized as a shift upward from the diagonal, while genes suppressed are seen as shifted downward. Both cell lines respond to radiation by rapidly inducing a subset of genes. While the gene induction is slightly delayed in the LYar cells, in both cell lines little gene suppression is observed. Many of the genes induced in response to radiation are induced in both cell lines. These genes are visualized as falling along the diagonal when LYar cells are plotted against LYas cells (K–P). Points deviating from the diagonal represent genes differentially expressed between the two cell lines. Two distinct populations (survival response versus death response) were detected within 30 min after irradiation. This is the earliest distinct measure (occurring between 15 and 30 min after irradiation) defining a death versus a survival response in these cells. All other measures of apoptosis in these cells—i.e., GSH loss, decrease in mitochondrial membrane intensity, loss of cytochrome c, and DNA fragmentation—occur beginning at least 1.5 hr after irradiation (–5, 33, 34). It should be pointed out that many of these messages code for genes of unknown function, and further characterization would lead to confirmation for our proposed pathways and additional new pathways.
Figure 3
Figure 3
Cluster Analysis of LYar and LYas response to radiation reveals mitochondrial and apoptotic gene induction. (A) To categorize the responses of the two cell lines to radiation, Pearson rank cluster analysis was performed on the average difference (AD, calculated by subtracting the mismatch signal from the perfect match signal) values for all 11,000 genes present on the array (1). The AD value for each gene was subtracted from the AD value for that gene in unirradiated LYas cells to cluster the genes with similar changes in expression levels. Each column presents the expression of that gene at the indicated time relative to unirradiated LYas cells. Red indicates increased expression, and green indicates decreased gene expression. Line length in the dendrogram indicates correlation, with shorter lines indicating greater correlation. Three major groups of genes emerged after radiation. Genes that were induced in both cell lines (red), genes preferentially elevated in LYar cells [fatty acid binding proteins (FABPs), CD53, and fructose-1,6-bisphosphatase] (blue), and genes elevated in LYas cells (see below) (yellow). The complete data set can be found at http://apoptosis.stanford.edu. (B) Radiation-induced genes expressed in LYas and LYar cells. Discrete cluster subsets from above data detailing genes induced by radiation only in LYas cells (Upper) and in both cell lines (Lower). Of the genes induced in LYas cells only, some have previously been implicated in regulating apoptosis (blue), and a subset of mitochondrial genes is also identified (green). Most of the genes induced in both cell lines are ribosomal genes. (C) AD time course for voltage-dependent anion channel (VDAC) and mitochondrial uncoupling protein (UCP) family members from mRNA collected at 0, 15, 30, 45, 60, and 120 min after 5 Gy of irradiation. Significant mRNA message increased only for UCP-2 in the LYas cells (Left). VDAC-1 is the only family member that increased dramatically (Right). Increased message is detected immediately after radiation exposure and plateaus at 1 hr.
Figure 4
Figure 4
Hypothetical LYar and LYas cells. From the data obtained, we have constructed a hypothetical model for the genes involved in apoptosis regulation. (Upper) LYar cells, which have previously been shown to have elevated GSH (C) (3), expressed message for CD53 and fructose-1,6-bisphosphatase that was not detected in the LYas cells. Both of these genes can combine to maintain elevated intracellular pools of GSH by enhancing the transport of GSH precursors into the cell (A) and keeping GSH in its reduced form by generating NADPH by enhanced gluconeogenesis and pentose phosphate pathway activity (B). GSSG, oxidized GSH; GxR, glutathione reductase. (Lower) In contrast, LYas cells trigger apoptosis in response to radiation by means of initiating transcription of proteins that adversely affect mitochondrial function. Radiation-induced increases in VDAC-1 and UCP-2 (A) uncouple mitochondrial electron transport and dissipate mitochondrial membrane potential (Ψ) (B), thus activating the release of apoptogenic factors. This leads to the activation of catabolic enzymes (primarily caspases), which complete the cell death process (C). AIF, apoptosis-initiating factor; Cyt c, cytochrome c.

References

    1. Eisen M B, Spellman P T, Brown P O, Botstein D. Proc Natl Acad Sci USA. 1998;95:14863–14868. - PMC - PubMed
    1. Kodym R, Calkins P, Story M. J Biol Chem. 1999;274:5131–5137. - PubMed
    1. Mirkovic N, Voehringer D W, Story M D, McConkey D J, McDonnell T J, Meyn R E. Oncogene. 1997;15:1461–1470. - PubMed
    1. Story M D, Voehringer D W, Malone C G, Hobbs M L, Meyn R E. Int J Radiat Biol. 1994;66:659–668. - PubMed
    1. Voehringer D W, McConkey D J, McDonnell T J, Brisbay S, Meyn R E. Proc Natl Acad Sci USA. 1998;95:2956–2960. - PMC - PubMed

Publication types

MeSH terms

Substances

LinkOut - more resources