. 2000 Mar 14;97(6):2928-33.
doi: 10.1073/pnas.97.6.2928.

Rapid desensitization of the nitric oxide receptor, soluble guanylyl cyclase, underlies diversity of cellular cGMP responses

Affiliations

Rapid desensitization of the nitric oxide receptor, soluble guanylyl cyclase, underlies diversity of cellular cGMP responses

T C Bellamy et al. Proc Natl Acad Sci U S A. .

Abstract

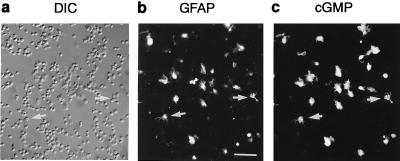
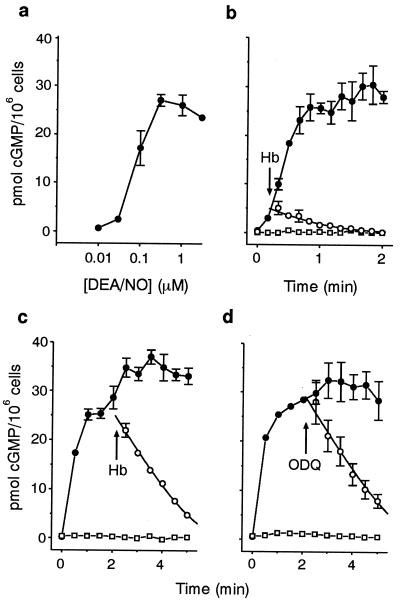
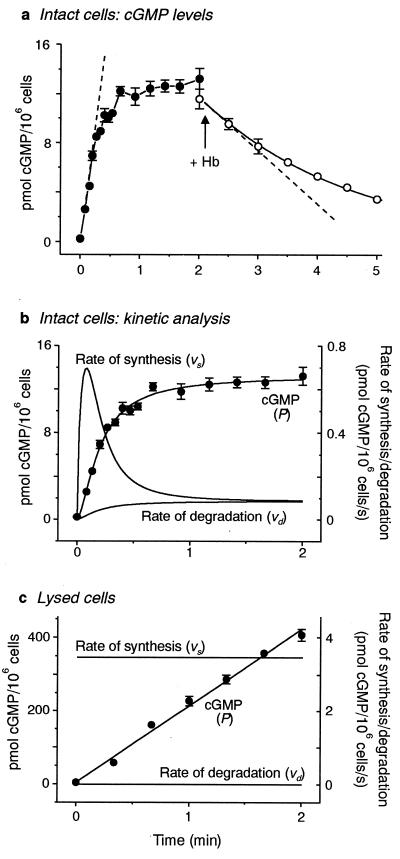
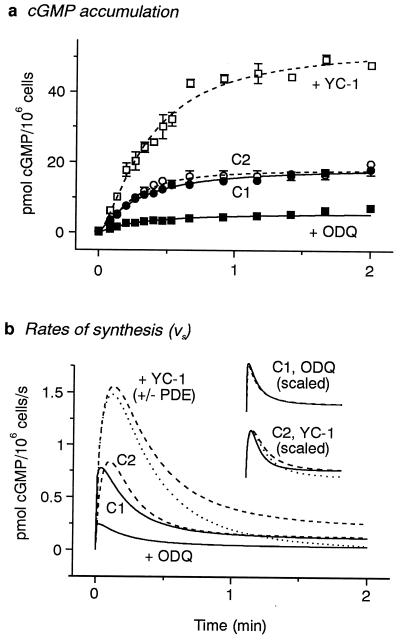
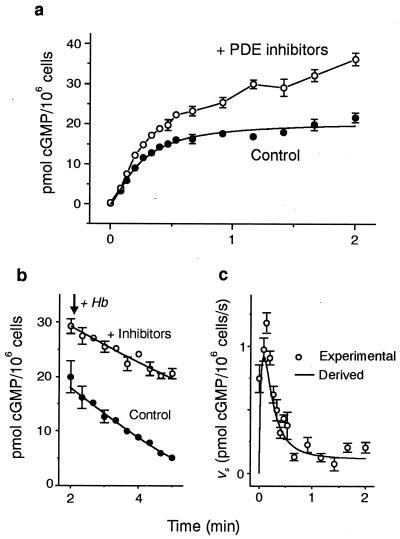
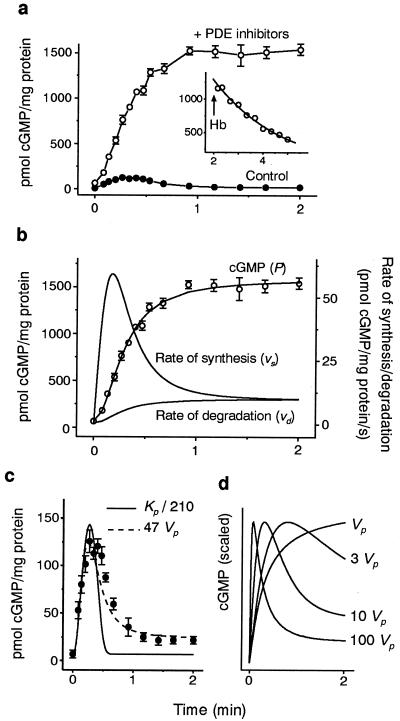
A major receptor for nitric oxide (NO) is the cGMP-synthesizing enzyme, soluble guanylyl cyclase (sGC), but it is not known how this enzyme behaves in cells. In cerebellar cells, NO (from diethylamine NONOate) increased astrocytic cGMP with a potency (EC(50) </= 20 nM) higher than that reported for purified sGC. Deactivation of NO-stimulated sGC activity, studied by trapping free NO with hemoglobin, took place within seconds (or less) rather than the minute time scale reported for the purified enzyme. Measurement of the rates of accumulation and degradation of cGMP were used to follow the activity of sGC over time. The peak activity, occurring within seconds of adding NO, was swiftly followed by desensitization to a steady-state level 8-fold lower. The same desensitizing profile was observed when the net sGC activity was increased or decreased or when cGMP breakdown was inhibited. Recovery from desensitization was relatively slow (half-time = 1.5 min). When the cells were lysed, sGC desensitization was lost. Analysis of the transient cGMP response to NO in human platelets showed that sGC underwent a similar desensitization. The results indicate that, in its natural environment, sGC behaves much more like a neurotransmitter receptor than had been expected from previous enzymological studies, and that hitherto unknown sGC regulatory factors exist. Rapid sGC desensitization, in concert with variations in the rate of cGMP breakdown, provides a fundamental mechanism for shaping cellular cGMP responses and is likely to be important in decoding NO signals under physiological and pathophysiological conditions.


Figures

Figure 1
Figure 1
Location of NO-stimulated cGMP accumulation in cerebellar cell suspension. The same field is shown under differential interference contrast optics (a) and after immunofluorescent staining for glial fibrillary acidic protein (b) and cGMP (c). The cells were fixed after 2-min exposure to DEA/NO (1 μM). Arrows indicate examples of colocalized staining in individual cells. Bar = 50 μm.
Figure 2
Figure 2
Characteristics of NO-stimulated cGMP accumulation in cerebellar cells. The concentration–cGMP response curve for DEA/NO (a) was obtained by using a 2-min exposure. Deactivation of sGC was determined by addition of Hb (50 μM) 15 s (b) or 125 s (c) after DEA/NO (1 μM) or by addition of ODQ (10 μM, d). ●, controls; □, Hb or ODQ added 5 s before DEA/NO; ○, Hb or ODQ added at arrows; solid lines fit the decline in cGMP to the Michaelis–Menten equation by using identical parameters (Kp and Vp).
Figure 3
Figure 3
Kinetics of cGMP synthesis and degradation in intact (a and b) and lysed (c) cerebellar cells. Filled symbols (a–c) represent cGMP levels after addition of DEA/NO (1 μM). Open symbols (a) chart the decline in cGMP after addition of Hb (at arrow); the data are fitted to the Michaelis–Menten equation (solid line). Broken lines (a) indicate the differing initial rates of cGMP accumulation and degradation. In b, the progress curve for cGMP accumulation (data from a) is fitted by a generalized hyperbola and vd and vs determined as described in Materials and Methods. In lysed cells (c), the linear cGMP accumulation is equivalent to an sGC activity of 4,140 pmol/mg protein/min; vd was eliminated by PDE inhibition.
Figure 4
Figure 4
Pharmacological manipulation of vs in cerebellar cells. In a, addition of 0.3 μM ODQ (■) decreased cGMP relative to the control (C1, ●); 100 μM YC-1(□) increased cGMP relative to the control (C2, ○). In all cases, the cells were stimulated with 1 μM DEA/NO and the time courses were fitted by a generalized hyperbola. The derived profiles of vs from these data are shown in b. For YC-1-treated cells, profiles assuming control PDE activity (dashed line) and zero PDE activity (dotted line) are both shown. In Insets, the profiles of vs are scaled by peak height; solid lines are the controls.
Figure 5
Figure 5
Effect of PDE inhibition in cerebellar cells. In a, addition of PDE inhibitors (100 μM sildenafil + 1 μM rolipram) (○) increased the cGMP response to DEA/NO (1 μM) relative to control (●). The control response was fitted by the usual hyperbolic function (solid line). In b, decay of cGMP levels is shown after addition of 10 μM Hb in the presence (○) and absence (●) of the PDE inhibitors. Solid lines fit the data to the Michaelis–Menten equation. In c are the profiles of vs generated by differentiating the cGMP data obtained in the presence of the PDE inhibitors (○) and by the usual analysis of the control cGMP accumulation data (solid line). Differentiation was carried out by using microcal origin software, Ver. 4.10.
Figure 6
Figure 6
Kinetics of cGMP synthesis and degradation in human platelets. The accumulation of cGMP induced by DEA/NO (1 μM) in the presence (○) and absence (●) of PDE inhibitors (100 μM sildenafil + 100 μM erythro-9-(2-hydroxy-3-nonyl)adenine) is in a. (Inset) Decay of cGMP levels after addition of 10 μM Hb in the presence of the PDE inhibitors, fitted by the Michaelis–Menten equation. At the 2-min time-point, extracellular cGMP accounted for 52 ± 8 pmol/mg protein (about 3% of total), which was subtracted from each data point. The analysis of vs and vd in the presence of the PDE inhibitors is shown in b, together with the raw data. In c, the cGMP response in control platelets (●) is shown; the parameters, Vp and Kp, describing cGMP breakdown in the presence of the PDE inhibitors were altered by increasing Vp or decreasing Kp as indicated. In d are depicted the different shapes of cGMP response (scaled to the peaks) that would be produced by a combination of a desensitizing vs and increases in Vp (both derived from cerebellar cells stimulated with DEA/NO). Reductions in Kp have broadly similar effects, except that with a low Kp, the late phase becomes truncated (cf. solid line in c).

References

    1. Moncada S, Palmer R M, Higgs E A. Pharmacol Rev. 1991;43:109–142. - PubMed
    1. Garthwaite J, Boulton C L. Annu Rev Physiol. 1995;57:683–706. - PubMed
    1. Waldman S A, Murad F. Pharmacol Rev. 1987;39:163–196. - PubMed
    1. Ignarro L J. Biochem Pharmacol. 1991;41:485–490. - PubMed
    1. Sunahara R K, Dessauer C W, Gilman A G. Annu Rev Pharmacol Toxicol. 1996;36:461–480. - PubMed

Publication types

LinkOut - more resources