Comparative Study
. 2000 Mar;105(6):765-75.
doi: 10.1172/JCI8624.

Th2 responses induced by epicutaneous or inhalational protein exposure are differentially dependent on IL-4

Affiliations
Comparative Study

Th2 responses induced by epicutaneous or inhalational protein exposure are differentially dependent on IL-4

C A Herrick et al. J Clin Invest. 2000 Mar.

Abstract

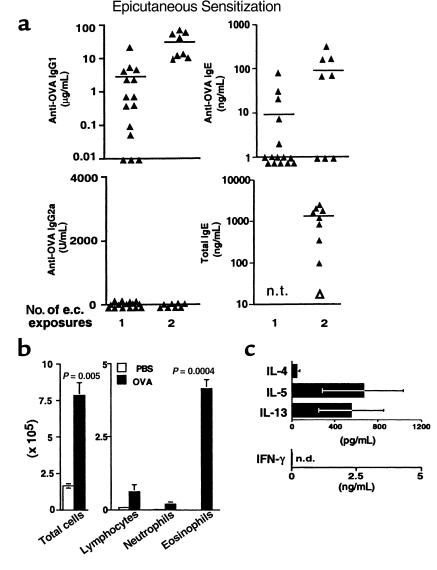
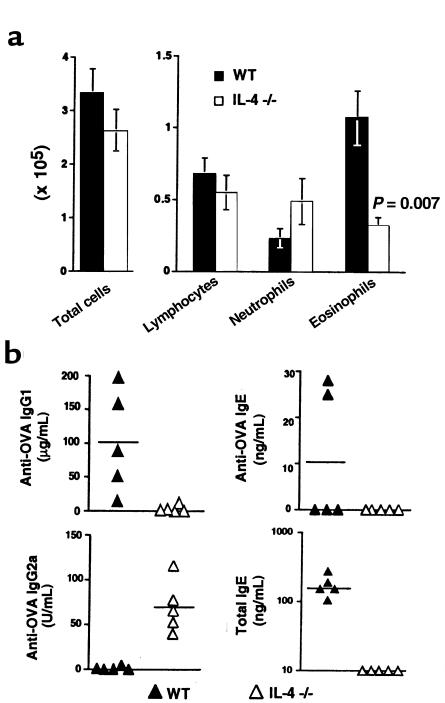
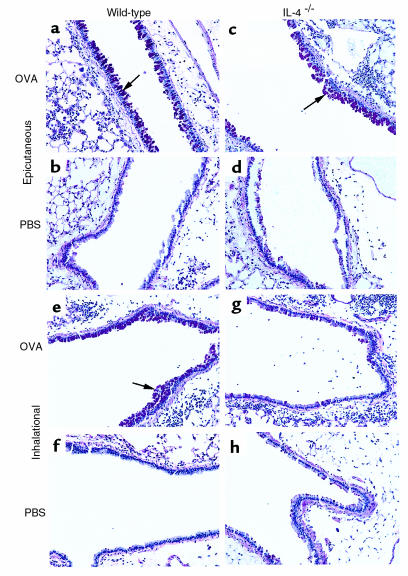
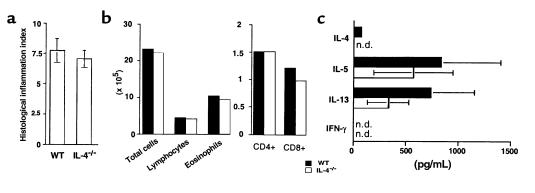
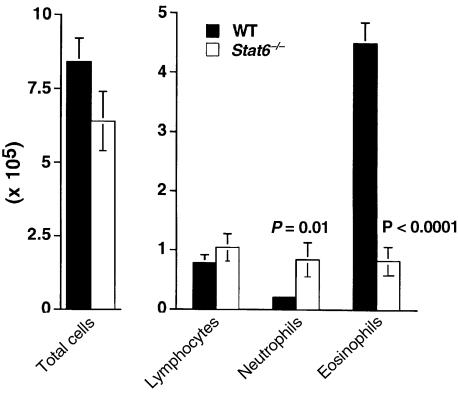
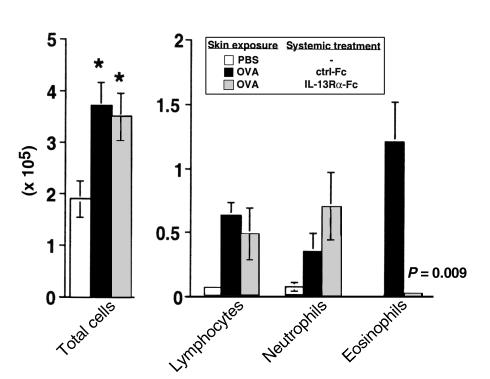
Atopic individuals are predisposed to mounting vigorous Th2-type immune responses to environmental allergens. To determine the factors responsible, animal models that closely mimic natural modes of allergen exposure should prove most informative. Therefore, we investigated the role of IL-4, a known Th2-promoting cytokine, in generation of Th2 responses after exposure of either the skin or airway to soluble protein. Compared with wild-type (WT) mice, IL-4-deficient (IL-4(-/-)) mice showed markedly impaired Th2 activation after primary exposure to inhaled ovalbumin (OVA), with decreased OVA-specific IgG1 and IgE, and significantly fewer eosinophils in bronchoalveolar lavage (BAL) fluid after airway challenge. In contrast, IL-4(-/-) mice initially exposed to epicutaneous (e.c.) OVA mounted Th2 responses equivalent to responses in WT mice, with high numbers of eosinophils in BAL fluid. Because Th2 responses were not induced by e.c. OVA exposure in Stat6(-/-) mice (mice lacking signal transducer and activator of transcription 6), the role of IL-13 was tested. In vivo depletion of IL-13 prevented Th2 responses induced by e.c. OVA exposure in IL-4(-/-) mice. These data demonstrate a marked difference in the IL-4 dependence of Th2 responses generated at two anatomic sites of natural allergen encounter and identify the skin as a particularly potent site for Th2 sensitization.


Figures

Figure 1
Figure 1
Th2 responses after e.c. OVA exposure. (a) Mice were exposed to e.c. OVA (100 μg) under an occlusive skin patch either once (on day 0) or twice (on days 0 and 14). Serum was obtained for measurement of antibodies by ELISA on days 13 and 27. Data points represent values for individual mice with the mean indicated and are from 4 experiments. The open triangle at the bottom right represents the value for pooled preimmune serum. n.t., not tested. (b) Mice initially exposed epicutaneously to either OVA (100 μg) in PBS or PBS alone on day 0 were challenged with i.n. OVA (25 μg) on days 14, 15, 18, and 19. On day 21, mice were sacrificed, BAL was performed, and total cell yield and differential counts in cytospin preparations from individual mice were determined. Both the total number of cells recovered by BAL and the number of each cell type are shown. Data are reported as mean ± SEM of 3 (PBS) or 5 (OVA) mice per group. One representative experiment of 3 experiments with similar results is shown. Statistical significance between PBS-exposed and OVA-exposed groups was determined by unpaired Student’s t test. (c) After BAL on day 21, lungs from 5–10 mice initially exposed to e.c. OVA were harvested and pooled. Inflammatory cells were isolated by enzymatic digestion. Cells were restimulated in vitro by culture with OVA (100 μg/mL) for 48 hours. Cytokine levels in supernatants were measured by ELISA. Data are reported as mean ± SEM from 2 experiments. n.d., none detected. Cytokine levels in cultures without OVA: IFN-γ, n.d.; IL-4, n.d.; IL-5, 156 pg/mL; IL-13, 59 pg/mL. No cytokines were detected in cultures of lung cells from naive mice with or without OVA treatment.
Figure 2
Figure 2
Th2 responses after i.n. OVA exposure. Mice received an initial course of i.n. OVA (100 μg on day 0–2), and then a second challenge course (25 μg on days 14, 15, 18, and 19). (a) Serum was obtained for measurement of antibodies by ELISA on days 13 and 21. Data points represent values for individual mice with the mean indicated, and are from 2 experiments. The open triangle at bottom right represents the value for pooled preimmune serum. (b) Mice initially exposed to either i.n. OVA (100 μg) in PBS or PBS alone on days 0–2 were challenged with i.n. OVA (25 μg) on days 14, 15, 18, and 19. On day 21, mice were sacrificed, BAL was performed, and total cell yield and differential counts in cytospin preparations from individual mice were determined. Both the total number of cells recovered by BAL and the number of each cell type are shown. Data are reported as mean ± SEM of 3 (PBS) or 5 (OVA) mice per group. One representative experiment of 3 experiments with similar results is shown. Statistical significance between PBS-exposed and OVA-exposed groups was determined by unpaired Student’s t test. (c) After BAL on day 21, lungs from 5–10 mice initially exposed to i.n. OVA were harvested and pooled. Inflammatory cells were isolated by enzymatic digestion. Cells were restimulated in vitro by culture with OVA (100 μg/mL) for 48 hours, and cytokine levels in supernatants were measured by ELISA. Data are reported as mean ± SEM from 2 experiments. Cytokine levels in cultures without OVA: IFN-γ, n.d.; IL-4, n.d.; IL-5, 135 pg/mL; IL-13, n.d. No cytokines were detected in cultures of lung cells from naive mice with or without OVA treatment.
Figure 3
Figure 3
Airway inflammatory responses and serum antibody production in i.n. OVA–sensitized IL-4–/–mice. C57BL/6 (WT) or IL-4–/– mice were initially exposed to i.n. OVA (100 μg) on days 0–2, and then challenged with i.n. OVA (25 μg) on days 14, 15, 18, and 19. (a) On day 21, mice were sacrificed, BAL was performed, and total cell yield and differential counts in cytospin preparations from individual mice were determined. Data were pooled from 2 experiments and are reported as mean ± SEM of 8 (WT) or 9 (IL-4–/–) mice per group. Both the total number of cells recovered by BAL and the number of each cell type are shown. Statistical significance between WT and IL-4–/– groups was determined by unpaired Student’s t test. (b) Serum was obtained for measurement of antibodies by ELISA on day 21. Data points represent values for individual mice with the mean indicated, and are from 1 representative experiment of 2 with similar results.
Figure 4
Figure 4
PAS staining of lung sections (×200) from epicutaneously or inhalation-sensitized mice after airway challenge with OVA. Mice were initially exposed to either e.c. or i.n. OVA or PBS. Beginning on day 14, all mice were challenged with i.n. OVA over a 6-day period, and lungs were harvested for histologic analysis on day 21.
Figure 5
Figure 5
Airway inflammatory responses and serum antibody production in e.c. OVA–sensitized IL-4–/– mice. C57BL/6 WT or IL-4–/– mice were initially exposed to e.c. OVA (100 μg) on day 0, and then challenged with i.n. OVA (25 μg) on days 14, 15, 18, and 19. (a) On day 21, mice were sacrificed, BAL was performed, and total cell yield and differential counts in cytospin preparations from individual mice were determined. Data were pooled from 2 experiments and are reported as mean ± SEM of 6 (WT) or 7 (IL-4–/–) mice per group. Both the total number of cells recovered by BAL and the number of each cell type are shown. No statistically significant differences were found between WT and IL-4–/– groups as determined by unpaired Student’s t test. (b) Serum was obtained for measurement of antibodies by ELISA on day 21. Data points represent values for individual mice with the indicated mean, and are from 1 representative experiment of 2 with similar results.
Figure 6
Figure 6
Comparison of lung inflammatory responses after airway challenge of epicutaneously sensitized WT or IL-4–/– mice. C57BL/6 WT or IL-4–/– mice were initially exposed to e.c. OVA (100 μg) on day 0, challenged with i.n. OVA (25 μg) on days 14, 15, 18, and 19, and sacrificed on day 21. (a) In some experiments, lungs were harvested, processed for routine histologic analysis (H&E staining), and scored for inflammation (see Methods). Data are from 3 experiments and are reported as the mean ± SEM of 11 (WT) or 13 (IL-4–/–) mice per group. (b and c) In other experiments, lungs were harvested from 5–10 mice per group and pooled. Inflammatory cells were isolated by enzymatic digestion. Cells were then either analyzed by flow cytometry or restimulated in vitro by culture with OVA (100 μg/mL) for 48 hours, and cytokine levels were measured in supernatants by ELISA. Data are reported as the number of cells isolated per mouse from a representative experiment (b), or as the mean ± SEM cytokine concentration in culture supernatants from 2 experiments (c).
Figure 7
Figure 7
Cellular composition of BAL fluid after airway challenge of epicutaneously sensitized Stat6–/– mice. C57BL/6 WT or Stat6–/– mice were initially exposed to e.c. OVA (100 μg) on day 0, and then challenged with i.n. OVA (25 μg) on days 14, 15, 18, and 19. On day 21, mice were sacrificed, BAL was performed, and total cell yield and differential counts in cytospin preparations from individual mice were determined. Data were pooled from 2 experiments and are reported as mean ± SEM of both the total number of cells recovered by BAL and the number of each cell type. Statistical significance between WT (n = 9) and Stat6–/– (n = 7) groups was determined by unpaired Student’s t test.
Figure 8
Figure 8
Cellular composition of BAL fluid after airway challenge of epicutaneously sensitized IL-4–/– mice depleted of IL-13 in vivo. IL-4–/– mice were initially exposed epicutaneously to either OVA (100 μg) in PBS or PBS alone on day 0, and then challenged with i.n. OVA (25 μg) on days 14, 15, 18, and 19. OVA-exposed mice also received intraperitoneal injections of either an IL-13 antagonist (IL-13Rα-Fc) or the Fc control (ctrl-Fc) every other day, from day –1 to day 19. On day 21, mice were sacrificed, BAL was performed, and total cell yield and differential counts in cytospin preparations from individual mice were determined. Data are reported as mean ± SEM (3 mice per group) of both the total number of cells recovered by BAL and the number of each cell type. Statistical significance between groups was determined by unpaired Student’s t test. *P < 0.05 for PBS-exposed vs. OVA-exposed groups; P = 0.009 for eosinophils IL-13Rα-Fc vs. ctrl-Fc–treated groups.

References

    1. van Reijsen FC, et al. Skin-derived aeroallergen-specific T-cell clones of Th2 phenotype in patients with atopic dermatitis. J Allergy Clin Immunol. 1992;90:184–192. - PubMed
    1. Hamid Q, Boguniewicz M, Leung DY. Differential in situ cytokine gene expression in acute vs. chronic atopic dermatitis. J Clin Invest. 1994;94:870–876. - PMC - PubMed
    1. Hamid Q, et al. In vivo expression of IL-12 and IL-13 in atopic dermatitis. J Allergy Clin Immunol. 1996;98:225–231. - PubMed
    1. Robinson D, et al. Activation of CD4+ T cells, increased TH2-type cytokine mRNA expression, and eosinophil recruitment in bronchoalveolar lavage after allergen inhalation challenge in patients with atopic asthma. J Allergy Clin Immunol. 1993;92:313–324. - PubMed
    1. Robinson DS, et al. Predominant TH2-like bronchoalveolar T-lymphocyte population in atopic asthma. N Engl J Med. 1992;326:298–304. - PubMed

Publication types

MeSH terms