Comparative Study
. 2000 Mar;105(6):823-32.
doi: 10.1172/JCI8195.

Prostaglandin G/H synthase-2 is required for maximal formation of osteoclast-like cells in culture

Affiliations
Comparative Study

Prostaglandin G/H synthase-2 is required for maximal formation of osteoclast-like cells in culture

Y Okada et al. J Clin Invest. 2000 Mar.

Abstract

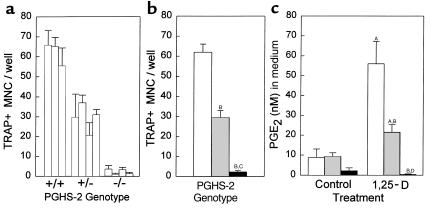
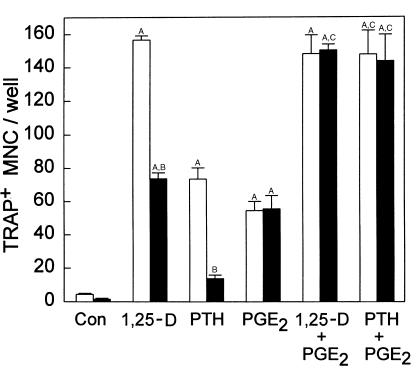
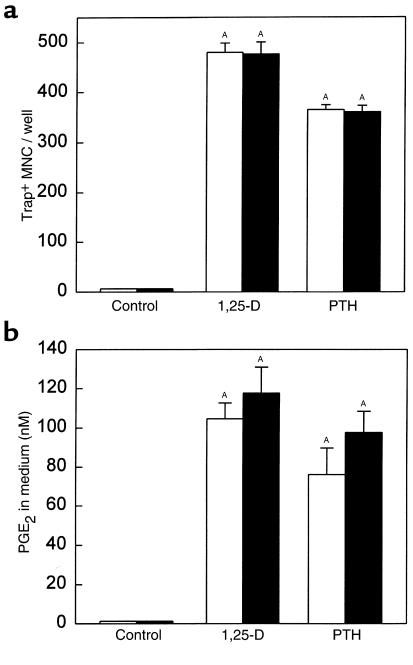
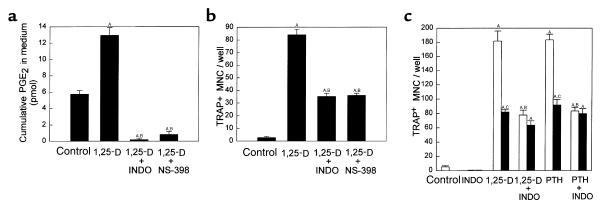
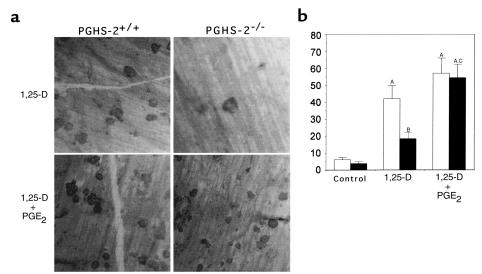
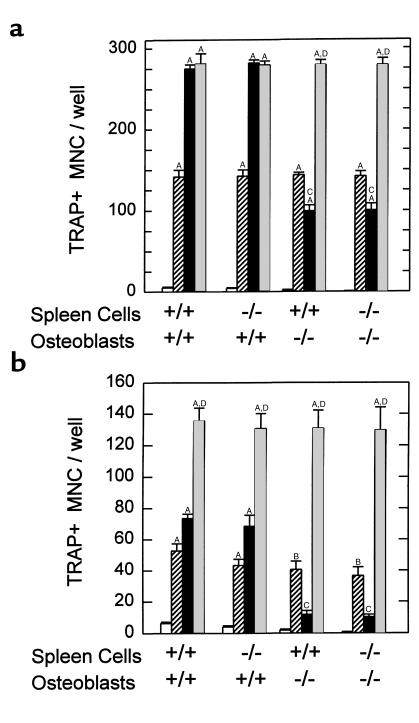
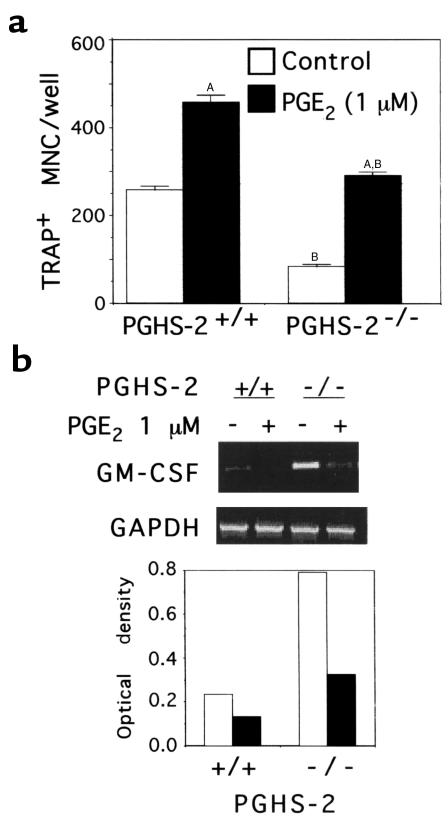
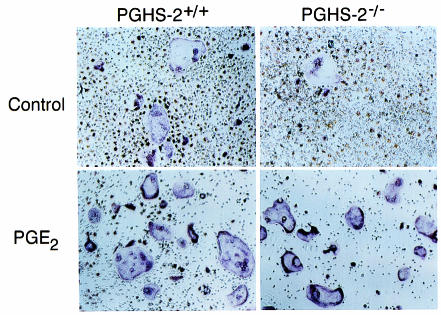
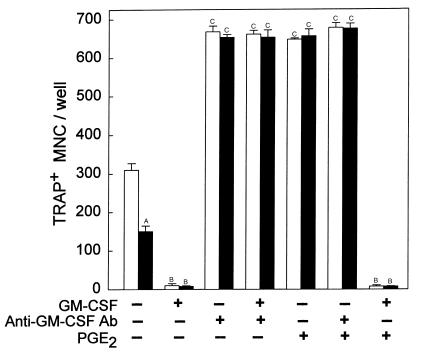
We examined the effect on osteoclast formation of disrupting the prostaglandin G/H synthase genes PGHS-1 and-2. Prostaglandin E(2) (PGE(2)) production was significantly reduced in marrow cultures from mice lacking PGHS-2 (PGHS-2(-/-)) compared with wild-type (PGHS-2(+/+)) cultures. Osteoclast formation, whether stimulated by 1,25-dihydroxyvitamin D(3) (1,25-D) or by parathyroid hormone (PTH), was reduced by 60-70% in PGHS-2(-/-) cultures relative to wild-type cultures, an effect that could be reversed by providing exogenous PGE(2). Cultures from heterozygous mice showed an intermediate response. PGHS inhibitors caused a similar drop in osteoclast formation in wild-type cultures. Co-culture experiments showed that supporting osteoblasts, rather than osteoclast precursors, accounted for the blunted response to 1,25-D and PTH. This lack of response appeared to result from reduced expression of RANK ligand (RANKL) in osteoblasts. We cultured spleen cells with exogenous RANKL and found that osteoclast formation was 50% lower in PGHS-2(-/-) than in wild-type cultures, apparently because the former cells expressed high levels of GM-CSF. Injection of PTH above the calvaria caused hypercalcemia in wild-type but not PGHS-2(-/-) mice. Histological examination of bone from 5-week-old PGHS-2(-/-) mice revealed no abnormalities. Mice lacking PGHS-1 were similar to wild-type mice in all of these parameters. These data suggest that PGHS-2 is not necessary for wild-type bone development but plays a critical role in bone resorption stimulated by 1,25-D and PTH.


Figures

Figure 1
Figure 1
TRAP+ MNC formation and PGE2 production in 1,25-D–stimulated bone marrow cultures from PGHS-2+/+, PGHS-2+/–, and PGHS-2–/– mice. Cultures were treated for 8 days with vehicle (Control) or 1,25-D (10 nM). (a) Each bar represents the mean ± SE of 3 replicate wells for marrow cultured from 1 mouse and treated with 1,25-D. All mice were from 2 litters born within a day of each other. No TRAP+ MNC were seen in control cultures. (b) The mean (± SE) number of TRAP+ MNC for each genotype was calculated from the mean for individual mice: PGHS-2+/+ (white bar), PGHS-2+/– (gray bar), and PGHS-2–/– (black bar). (c) Medium from 1 well per mouse was taken at the end of the culture period and assayed in duplicate for PGE2. Genotypes are as in b. ASignificant difference from control group; P < 0.01. BSignificant difference from PGHS-2+/+ genotype; P < 0.01. CSignificant difference from PGHS-2+/– phenotype; P < 0.01. DSignificant difference from +/– phenotype; P < 0.05.
Figure 2
Figure 2
Effects of exogenous PGE2 on TRAP+ MNC formation in bone marrow cultures treated with 1,25-D and PTH. Marrow was pooled from several PGHS-2+/+ mice (white bars) or PGHS-2–/– mice (black bars) and was cultured for 7 days with vehicle (Con), 1,25-D (10 nM), or PTH (10 nM), with and without PGE2 (1 μM). Bars represent mean ± SE for TRAP+ MNC formation in 6 wells. ASignificant difference from control group; P < 0.01. BSignificant difference from comparably treated +/+ genotype; P < 0.01. CSignificant effect of addition of PGE2; P < 0.01.
Figure 3
Figure 3
Effect of PGHS-1 gene disruption on TRAP+ MNC formation and PGE2 production in marrow culture. Marrow from PGHS-1 knockout mice (black bars) or from wild-type littermates (white bars) was cultured with vehicle (Control) or 1,25-D (10 nM) for 7 days. (a) Bars represent mean ± SE for TRAP+ MNC in 4 wells. (b) Bars represent mean ± SE for medium PGE2 produced during the last 2 days of culture in 4 wells. ASignificant difference from control group; P < 0.01.
Figure 4
Figure 4
Effect of inhibitors of PGHS-1 and PGHS-2 activity on TRAP+ MNC formation in bone marrow cultures. Marrow was cultured for 7 days with vehicle (Con), 1,25-D (10 nM), or PTH (10 nM) in the presence or absence of either 0.1 μM indomethacin (INDO; an inhibitor of both PGHS-1 and PGHS-2 activity) or 0.1 μM NS-398, a selective inhibitor of PGHS-2 activity. Bars represent mean ± SE of 4 wells. Comparison of 1,25-D–stimulated cumulative PGE2 (a) and TRAP+ MNC formation (b) in PGHS-2+/+ cultures. (c) Comparison of 1,25-D– and PTH-stimulated TRAP+ MNC formation, with and without indomethacin, in PGHS-2+/+ cultures (white bars) and PGHS-2–/– cultures (black bars). ASignificant difference from control group; P < 0.01. BSignificant effect of inhibitor; P < 0.01. CSignificant difference from +/+ genotype; P < 0.01.
Figure 5
Figure 5
Formation of resorption pits on cortical bone slices by cultured marrow cells from PGHS-2+/+ mice (white bars) and PGHS-2–/– mice (black bars). Cultures were treated with either vehicle (Control) or 1,25-D (10 nM) with and without PGE2 (1 μM). An osteoclast resorption pit was defined as having multiple overlapping resorption lacunae. (a) Photomicrograph of resorption pits on cortical bone. (b) Number of resorption pits counted on 6 bone slices (mean ± SE). ASignificant difference from control group; P < 0.01. BSignificant difference from 1,25-D–treated PGHS-2+/+ cells; P < 0.05. CSignificant effect of addition of PGE2; P < 0.01.
Figure 6
Figure 6
TRAP+ MNC formation in cocultures of spleen cells and primary osteoblasts from PGHS-2+/+ and PGHS-2–/– mice. Osteoblasts were pooled from 4 populations from sequentially digested calvariae. Cocultures were treated with 1,25-D (10 nM) or PTH (10 nM), with or without PGE2 (1 μM) for 7 days and then stained for TRAP. Bars represent mean ± SE of quadruplicate cultures. (a) Cultures were treated with vehicle (open bars), PGE2 (striped bars), 1,25-D (black bars), or 1,25-D + PGE2 (gray bars). (b) Cultures were treated with vehicle (open bars), PGE2 (striped bars), PTH (black bars), or PTH + PGE2 (gray bars). ASignificant difference from vehicle treatment; P < 0.01. BSignificant difference from vehicle treatment; P < 0.05. CSignificant effect of PGHS-2–/– osteoblasts; P < 0.01. DSignificant difference from treatment with either agent alone; P < 0.01.
Figure 7
Figure 7
Effect of disruption of the PGHS-2 gene on TRAP+ MNC formation and GM-CSF mRNA expression in spleen cells cultured without osteoblasts. Cultures were treated with M-CSF (10 ng/mL) and RANKL (10 ng/mL), and then with either vehicle (Control; white bars) or PGE2 (1 μM; black bars). (a) TRAP+ MNC formed after 6 days of culture. Data are expressed as mean ± SE for quadruplicate cultures. (No TRAP+ MNC were formed in cultures without RANKL and M-CSF; data not shown.) ASignificant difference from vehicle treatment; P < 0.01. BSignificant effect of PGHS-2–/– genotype; P < 0.01. (b) RT-PCR analysis of GM-CSF mRNA levels at the end of the culture period for the experiment shown in a. Ethidium bromide–stained RT-PCR products are shown in the top panel. The optical density ratios of GM-CSF mRNA to GAPDH mRNA are shown in the bottom panel.
Figure 8
Figure 8
Effect of PGE2 on RANKL- and M-CSF-stimulated spleen cell cultures. RANKL-stimulated (10 ng/mL) and M-CSF–stimulated (10 ng/mL) spleen cells from PGHS-2+/+ and PGHS-2–/– mice were treated for 6 days with vehicle (Control) or PGE2 (1 μM) and then stained for TRAP.
Figure 9
Figure 9
Effects of GM-CSF and a blocking antibody to GM-CSF on TRAP+ MNC formation in RANKL- and M-CSF–stimulated spleen cell cultures. Spleen cells from PGHS-2+/+ (white bars) and PGHS-2–/– (black bars) mice were cultured for 6 days with RANKL (10 ng/mL) and M-CSF (10 ng/mL). Cultures were also treated with vehicle (Control), murine GM-CSF (1 ng/mL), murine polyclonal antibody to GM-CSF (1 μg/mL), or PGE2 (1 μM). Bars represent mean ± SE for quadruplicate cultures. ASignificant effect of –/– genotype; P < 0.01. BSignificant effect of GM-CSF; P < 0.01. CSignificant effect of anti–GM-CSF antibody or PGE2; P < 0.01.

References

    1. Smith WL, Garavito RM, DeWitt DL. Prostaglandin endoperoxide H synthases (cyclooxygenases)-1 and -2. J Biol Chem. 1996;271:29569–29575. - PubMed
    1. Kujubu DA, Fletcher BS, Varnum BC, Lim RW, Herschman HR. TIS10, a phorbol ester tumor promoter-inducible mRNA from Swiss 3T3 cells, encodes a novel prostaglandin synthase/cyclooxygenase homologue. J Biol Chem. 1991;266:12866–12872. - PubMed
    1. Reddy ST, Herschman HR. Transcellular prostaglandin production following mast cell activation is mediated by proximal secretory phospholipase A2 and distal prostaglandin synthase 1. J Biol Chem. 1996;271:186–191. - PubMed
    1. Reddy ST, Herschman HR. Prostaglandin synthase-1 and prostaglandin synthase-2 are coupled to distinct phospholipases for the generation of prostaglandin D2 in activated mast cells. J Biol Chem. 1997;272:3231–3237. - PubMed
    1. Chulada PC, Langenbach R. Differential inhibition of murine prostaglandin synthase-1 and -2 by nonsteroidal anti-inflammatory drugs using exogenous and endogenous sources of arachidonic acid. J Pharmacol Exp Ther. 1997;280:606–613. - PubMed

Publication types

MeSH terms

Substances