. 2000 Apr 1;20(7):2451-8.
doi: 10.1523/JNEUROSCI.20-07-02451.2000.

Synaptic activity modulates the induction of bidirectional synaptic changes in adult mouse hippocampus

Affiliations

Synaptic activity modulates the induction of bidirectional synaptic changes in adult mouse hippocampus

A Ngezahayo et al. J Neurosci. .

Abstract

Activity-dependent synaptic plasticity is critical for learning and memory. Considerable attention has been paid to mechanisms that increase or decrease synaptic efficacy, referred to as long-term potentiation (LTP) and long-term depression (LTD), respectively. It is becoming apparent that synaptic activity also modulates the ability to elicit subsequent synaptic changes. We provide direct experimental evidence that this modulation is attributable, at least in part, to variations in the level of postsynaptic depolarization required for inducing plasticity. In slices from adult hippocampal CA1, a brief pairing protocol known to produce LTP can also induce LTD. The voltage-response function for the induction of LTD and LTP in naive synapses exhibits three parts: at a postsynaptic membrane potential during pairing (V(m)) </= -40 mV, no synaptic modification is obtained; at V(m) between -40 and -20 mV, LTD is induced; and, finally, at V(m) > -20 mV, LTP is generated. This function varies with initial synaptic efficacy. In depressed synapses, Theta(-), the V(m) above which LTD is generated, is shifted toward more depolarized V(ms) and Theta(+), the LTD-LTP crossover point or, equivalently, the V(m) above which LTP is induced, toward more polarized V(ms). Conversely in potentiated synapses, Theta(-) is shifted toward more polarized V(ms). Therefore synaptic activity changes synaptic efficacy and accordingly adjusts the voltages for eliciting subsequent synaptic modifications. The concomitant shifts in the voltages for inducing LTD and LTP in opposite directions promote synaptic potentiation and inhibit synaptic depression in depressed synapses and vice versa in potentiated synapses.


Figures
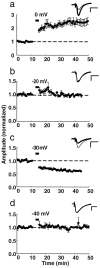
Fig. 1.
Fig. 1.
The direction of the synaptic modification depends on Vm during pairing. a–d, Summary graphs of whole-cell recordings in which synaptic stimulation (2 Hz, 50 sec) was paired to 0 mV (a;n = 6), −20 mV (b;n = 6), −30 mV (c;n = 6), and −40 mV (d;n = 4). Superimposed averages of 10 successive evoked EPSCs recorded before (thin trace) and 30 min after (thick trace) pairing in representative cells. Calibration bars: 20 msec, 50 pA.
Fig. 2.
Fig. 2.
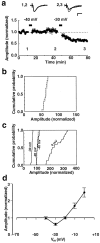
a, Summary graph of five whole-cell recordings in which synaptic stimulation was paired to −40 mV and 30 min later, to −30 mV. Superimposed traces are averages of 10 successive evoked EPSCs recorded in a representative cell as indicated in the graph. Trace 1 is thin andtrace 2 is thick in 1,2;trace 2 is thin and trace 3 is thick in 2,3. Calibration bars: 20 msec, 50 pA. b, Cumulative histograms showing the effect of a pairing to −30 mV in every cell when pairing occurred before (solid line; n = 19, including the results in Figs. 1c, 3a) and after (dotted line; n = 15, including the results in Figs. 2a, 3b, 5a) the washout of LTP mechanisms. c, Cumulative histograms showing the effect of a pairing to 0 mV (n = 23, including the results in Figs.1a, 6a), −20 mV (dotted line; n = 6, including the results in Fig.1b), −30 mV (n = 19, including the results in Figs. 1c, 3a), and −40 mV (n = 13, including the results in Figs.1d, 2a, 5a) in every cell when the pairing occurred before the washout of LTP mechanisms.d, Voltage–response function for the induction of LTD and LTP in naive synapses.
Fig. 3.
Fig. 3.
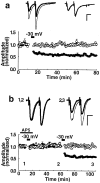
Induction of LTD in adult hippocampus with a brief pairing is input-specific and NMDA receptor-dependent.a, Summary graph of seven whole-cell recordings in which synaptic stimulation was paired to −30 mV in one pathway (filled symbols). Superimposed traces are averages of 10 successive evoked (paired-pulse stimulation) EPSCs in paired (left) and unpaired (right) pathways recorded in a representative cell before (thin trace) and 60 min after (thick trace) pairing.b, Summary graph of five whole-cell recordings in which synaptic stimulation was paired to −30 mV in one pathway in the presence and after washing out of 200 μm AP-5 (filled symbols). Superimposed traces are averages of 10 successive evoked (paired-pulse stimulation) EPSCs in the paired pathway recorded in a representative cell as indicated in the graph. Trace 1 is thin andtrace 2 is thick in 1,2;trace 2 is thin and trace 3 is thick in 2,3. Calibration bars: 20 msec, 50 pA.
Fig. 4.
Fig. 4.
Voltage–response function for the induction of LTD and LTP in depressed synapses. a, Summary graphs of six whole-cell recordings in which synaptic stimulation was paired to −30 mV (conditioning pairing) and 10 min later to −20 mV (test pairing) in one pathway (●). Synaptic stimulation was either paired to −20 mV (Δ; n = 3) or discontinued (○;n = 3) during test pairing in the second pathway. Superimposed traces are averages of 10 successive evoked (paired-pulse stimulation) EPSCs recorded in a representative cell before (thin trace) and 40 min after (thick trace) pairings to −30 and −20 mV in one pathway (left) and pairing to −20 mV in the other pathway (right). b, Summary graph of four whole-cell recordings in which synaptic stimulation was paired to −30 mV, two times at 10 min interval, in one pathway (filled symbols). Superimposed traces are as in a, left. Calibration bars: 20 msec, 50 pA. c, Voltage–response function for the induction of LTD and LTP in depressed synapses, superimposed with the same function in naive synapses.
Fig. 5.
Fig. 5.
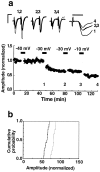
Induction of LTD in depressed synapses.a, Summary graph of four whole-cell recordings (different from those in Fig. 2a) in which synaptic stimulation was paired successively to −40, −30, −30, and −10 mV. Superimposed traces are averages of 10 successive evoked (paired-pulse stimulation) EPSCs recorded in a representative cell as indicated in the graph. Trace 1 is thin andtrace 2 is thick in 1,2;trace 2 is thin and trace 3 is thick in 2,3; trace 3 is thin and trace 4 isthick in 3,4. The traces are superimposed on the right at expanded time scale. Calibration bars: 20 and 10 msec (expanded time scale), 50 pA. b, Cumulative histograms showing the effect of a pairing to −30 mV (after the washout of LTP mechanisms) in naive synapses (dotted line; n = 15, including the results in Figs. 2a, 3b, 5a) and to −10 mV in previously depressed synapses (solid line;n = 10, including the results in a) in every cell.
Fig. 6.
Fig. 6.
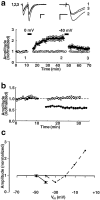
Induction of LTD is facilitated in potentiated synapses. a, Summary graph of seven whole-cell recordings in which synaptic stimulation was paired first to 0 mV and 35 min later to −40 mV in one pathway (●). In the second pathway (○; n = 3 of the 7 cells), synaptic stimulation was only paired to −40 mV during the second pairing. Superimposed traces (expanded time and amplitude scales on the right) are averages of 10 successive responses to paired-pulse stimulation of the first pathway (paired successively to 0 and −40 mV) recorded in a representative cell as indicated in the graph. Calibration bars:left, 20 msec, 50 pA; right, 10 msec, 50 pA). b, Summary graph of the effect of a second pairing, 35 min after pairing to 0 mV. This second pairing was to −40 mV (●; cells in a) and to −50 mV (○; n = 5). Amplitudes are normalized to the amplitude of synaptic responses just before this second pairing. c, Part of the voltage–response function for the induction of LTD and LTP in potentiated synapses, superimposed with the same function in naive synapses.
Fig. 7.
Fig. 7.
The voltage–response function for the induction of LTD and LTP varies with the initial state of the synapse. Superimposed voltage–response curves for the induction of LTD and LTP in potentiated, naive, and depressed synapses. The putative part of the curve in potentiated synapses is shown with stripped lines. From depressed to potentiated synapses, Θ and Θ+ slide away from each other (arrows), progressively opening the voltage window for LTD induction.

References

    1. Abraham WC, Bear MF. Metaplasticity: the plasticity of synaptic plasticity. Trends Neurosci. 1996;19:126–130. - PubMed
    1. Abraham WC, Huggett A. Induction and reversal of long-term potentiation by repeated high-frequency stimulation in rat hippocampal slices. Hippocampus. 1997;7:137–145. - PubMed
    1. Abraham WC, Tate WP. Metaplasticity: a new vista across the field of synaptic plasticity. Prog Neurobiol. 1997;52:303–323. - PubMed
    1. Artola A, Singer W. Long-term depression of excitatory synaptic transmission and its relationship to long-term potentiation. Trends Neurosci. 1993;16:480–487. - PubMed
    1. Artola A, Bröcher S, Singer W. Different voltage-dependent thresholds for inducing long-term depression and long-term potentiation in slices of rat visual cortex. Nature. 1990;347:69–72. - PubMed

Publication types

LinkOut - more resources