. 2000 Apr 1;20(7):2480-94.
doi: 10.1523/JNEUROSCI.20-07-02480.2000.

Release-independent short-term synaptic depression in cultured hippocampal neurons

Affiliations

Release-independent short-term synaptic depression in cultured hippocampal neurons

D L Brody et al. J Neurosci. .

Abstract

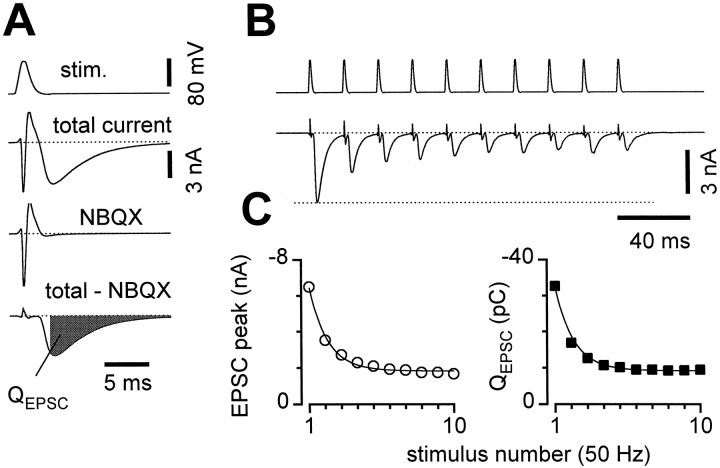
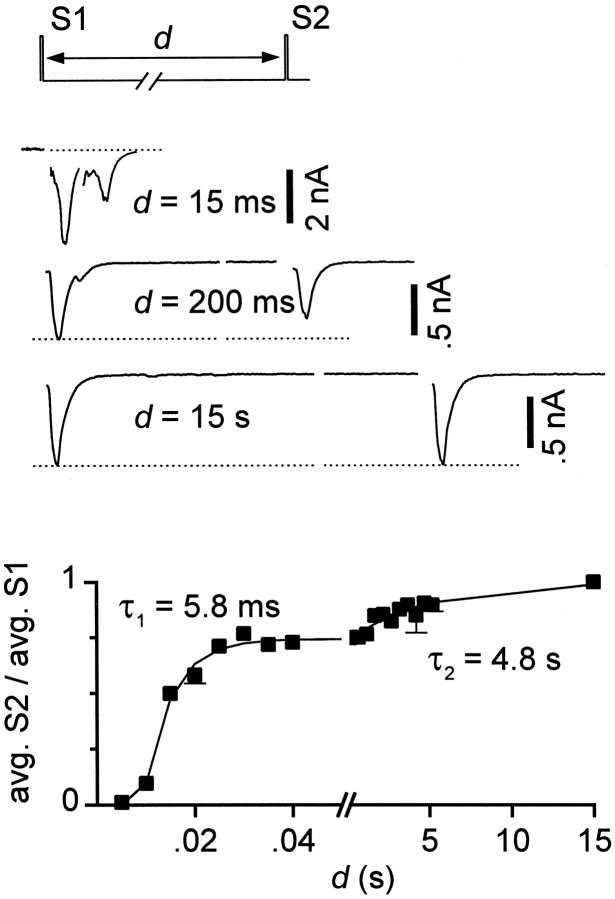
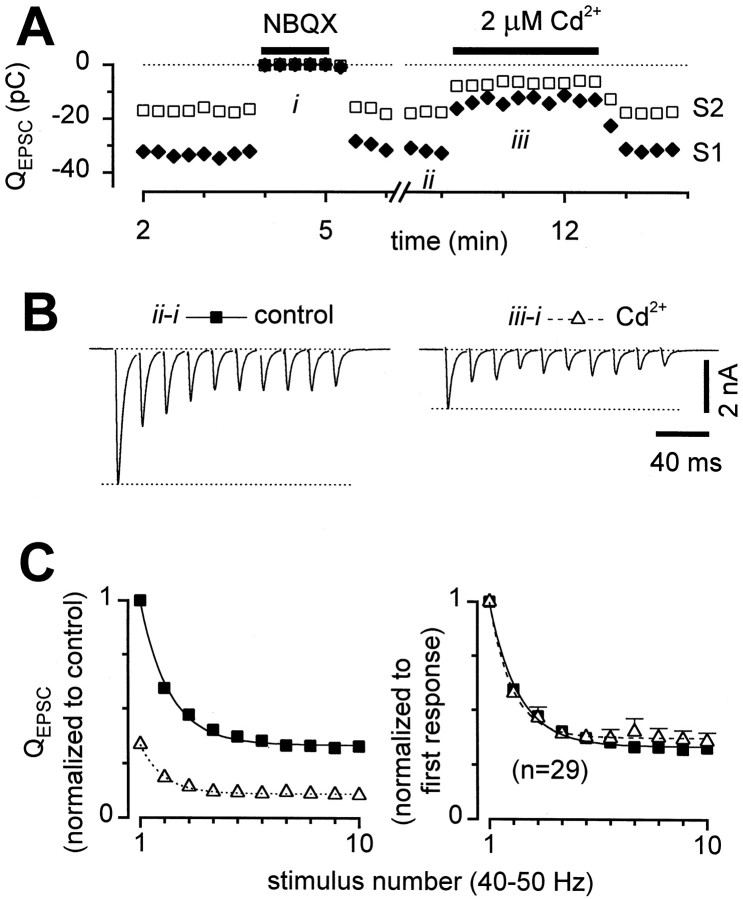
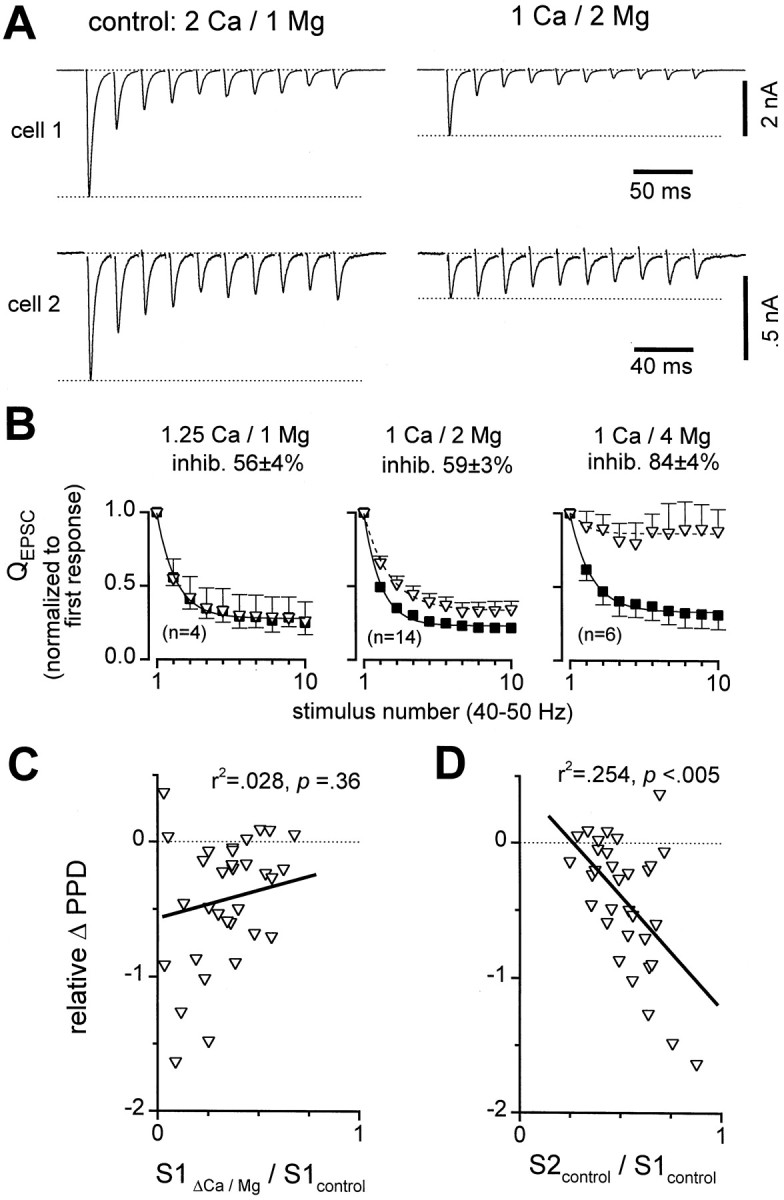
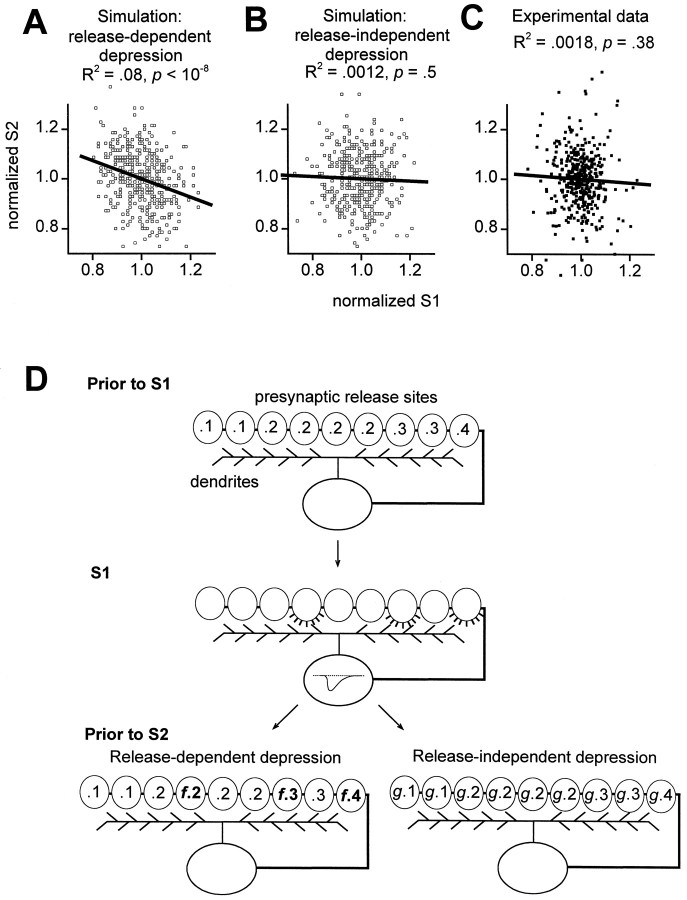
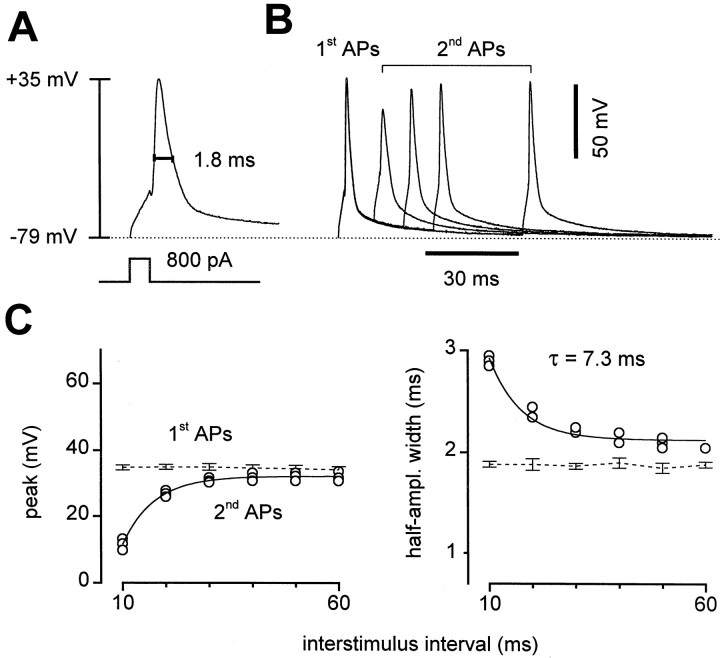
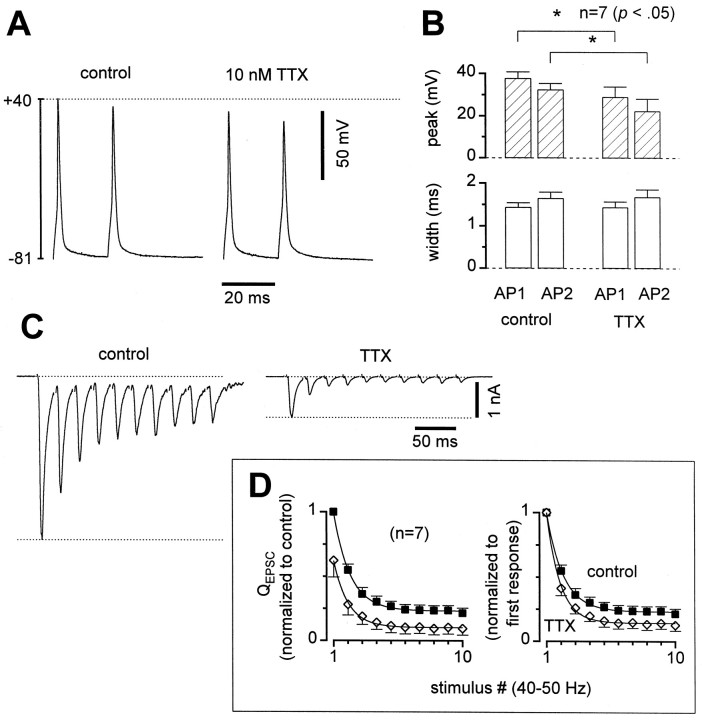
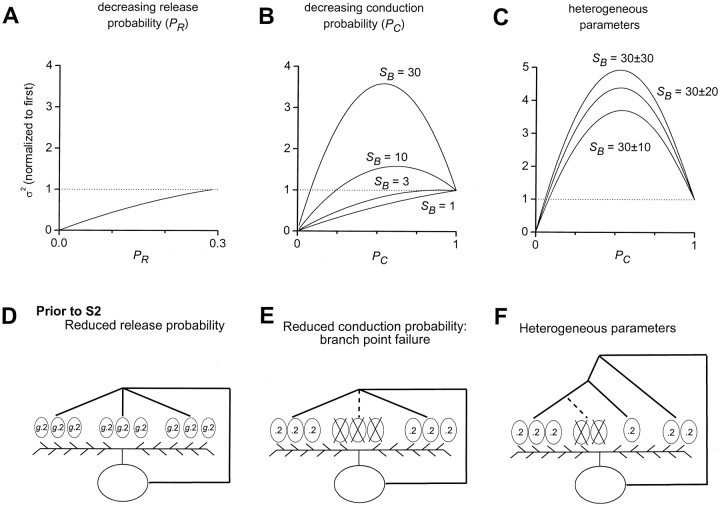
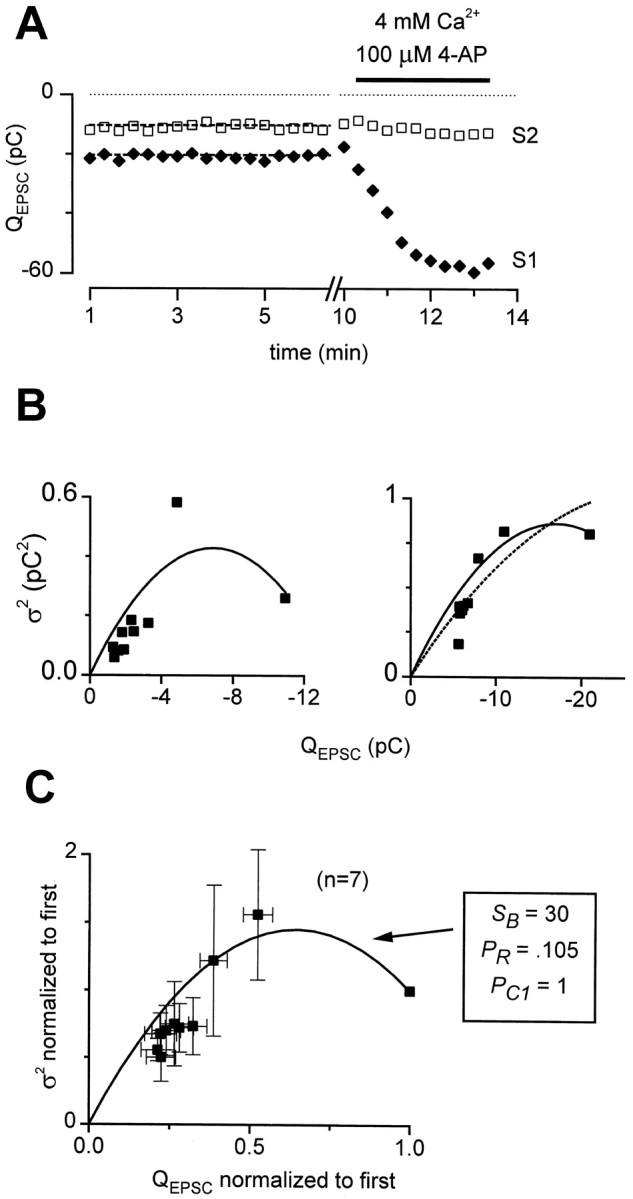
Short-term synaptic plasticity may dramatically influence neuronal information transfer, yet the underlying mechanisms remain incompletely understood. In autapses (self-synapses) formed by cultured hippocampal neurons, short-term synaptic depression (STD) had several unusual features. (1) Reduction of neurotransmitter release probability with Cd(2+), a blocker of voltage-gated calcium channels, did not change depression. (2) Lowering [Ca(2+)](o) and/or raising [Mg(2+)](o) had little effect on STD in cells with strong baseline depression, but in cells with more modest baseline depression, it reduced the depression. (3) Random variations in the size of initial EPSCs did not influence successive EPSC sizes. These findings were inconsistent with release-dependent mechanisms, such as vesicle depletion, post-synaptic receptor desensitization, and autoreceptor inhibition. Instead, other results suggested that changes in action potentials (APs) contributed to depression. The somatic APs declined in amplitude with repetitive stimulation, and modest reduction of AP amplitudes with tetrodotoxin inhibited EPSCs. Notably, tetrodotoxin also increased depression. Similar changes in axonal APs could produce STD in at least two ways. First, decreasing presynaptic spike amplitudes could reduce calcium entry and release probability. Alternatively, APs could fail to propagate through some axonal branches, reducing the number of active synapses. To explore these possibilities, we derived the expected variance of EPSCs for the two scenarios. Experimentally, the variance increased and then decreased on average with successive responses during trains of APs, confirming a unique prediction from the conduction failure scenario. Thus, STD had surprising properties, incompatible with commonly postulated mechanisms but consistent with AP conduction failure at axonal branches.


Figures

Fig. 1.
Fig. 1.
Short-term depression (STD) in microcultured hippocampal neurons. A, Voltage-clamp stimuli (stim.) were applied via a somatic patch pipette to single self-synaptic (autaptic) neurons in culture, and the resulting currents were recorded (total current). Synaptic currents were isolated by subtracting the current remaining in 2 μmNBQX (NBQX), from the total current (total − NBQX), and integrated over a 3–20 msec window after each stimulus (QEPSC). B, Isolated synaptic currents during a 50 Hz train of voltage-clamp stimuli.C, Both peak current (left) andQEPSC (right) equivalently represented the short-term depression. After scaling, the smooth monoexponential curve (time constant 22.5 msec) fit to peak currents (left) exactly described depression ofQEPSC (right, scaling by ∼5 pC/nA for this cell). Averages of 14 sweeps from the same cell as inA and B; error bars are smaller than symbols.
Fig. 2.
Fig. 2.
Recovery from depression occurred in two phases. Interstimulus interval (d) between pairs of stimuli (S1, S2) was varied between 5 msec and 15 sec. Shown are single sweeps for intervals of 15 msec, 200 msec, and 15 sec (top). QEPSC averages after second stimuli (avg. S2) were normalized byQEPSC averages after first stimuli (avg. S1). Five to ten sweeps were averaged for each interstimulus interval. Error bars not shown when smaller than symbols. The sum of two exponentials (smooth curve) was fit to the recovery of the EPSCs (avg. S2/avg. S1); for this cell, time constants were 5.8 msec and 4.8 sec, with relative amplitudes 0.74 and 0.26.
Fig. 3.
Fig. 3.
STD was not affected by reduction in release probability by Cd2+. A, Diary plot ofQEPSC for first stimuli (solid diamonds, S1) and second stimuli (open squares, S2) of 50 Hz stimulus trains. Both NBQX and Cd2+ were readily reversible. B, Sample records after NBQX subtraction, acquired at the times indicated byii and iii in the diary plot above. C,QEPSC averages across 29 cells. Left, Responses normalized by the first QEPSC in control (solid squares) for each cell, then averaged across cells, showing extent of inhibition by Cd2+(open triangles). Right, Responses normalized by first QEPSC in each condition, to facilitate comparison of STD. There were no statistically significant differences between control and Cd2+. Error bars not shown when smaller than symbols. Time constant of smooth curve was 23.8 msec.
Fig. 4.
Fig. 4.
Complex effects on depression with reduced [Ca2+]o and/or increased [Mg2+]o (ΔCa/Mg). A, Sample records from two cells, illustrating diverse effects of 1 Ca/2 Mg solution. In both cells 1 Ca/2 Mg reduced initial EPSCs, but depression in cell 1 was unchanged while depression incell 2 was reduced. Averages of four to nine traces displayed. B, Average effects of three different solutions. Control QEPSC responses were normalized by first response in control for each cell and averaged across cells (solid squares). Each ΔCa/Mg QEPSCwas normalized by first response in ΔCa/Mg before averaging across cells (open triangles). Inhib. refers to the average decrease in size of QEPSC after first stimuli in ΔCa/Mg compared with control. C, D, Multiple regression analysis of relative change in paired-pulse depression (relative ΔPPD) correlated with two factors:QEPSC size in ΔCa/Mg relative to control (S1ΔCa/Mg/S1control), and paired-pulse plasticity in control (S2control/S1control). Relative ΔPPD = (PPD in ΔCa/Mg − PPD in control)/PPD in control, where PPD = (S1 − S2)/S1. Data pooled across 31 cells in various ΔCa/Mg solutions; each symbol represents data from one cell, averaged over 5–20 sweeps. Partial correlation coefficients are denoted by r2 values. C, Scatter plot of relative ΔPPD versus initialQEPSC in ΔCa/Mg, normalized by initialQEPSC in control (S1ΔCa/Mg/S1control). There was no significant correlation (solid line) when both factors were considered. D, Scatter plot of relative ΔPPD versus paired-pulse plasticity in control (S2control/S1control). A significant correlation (solid line) was present even when both factors were considered; in cells with strongest baseline depression (S2control/S1control small), the depression was least affected by ΔCa/Mg.
Fig. 5.
Fig. 5.
Sweep-to-sweep fluctuations in first EPSC sizes did not affect second EPSCs. For both simulations and experimental data, each first QEPSC was normalized by the first QEPSC average (normalized S1) and each second QEPSC was normalized by the second QEPSC average (normalized S2).A, Simulation of release-dependent depression. Four hundred pairs of EPSCs were generated using a model with 500 binary release sites (see Materials and Methods). There was a significant inverse correlation between successive, normalized EPSC sizes (open squares, individual simulated EPSC pairs; solid line, linear regression). Regression slope was −0.37, with 95% confidence interval −0.49 to −0.25. B, Simulation of release-independent depression. There was no correlation here between successive normalized EPSC sizes. C, Experimental data; 415 sweeps in control solutions (solid squares) taken from 28 stable cells were normalized for each cell and then pooled. No significant correlation between normalized first and second EPSC sizes; the slope of the best fit regression line through the data was −0.074, with 95% confidence interval −0.24 to 0.09. D, Simplified illustration of release-dependent versus release-independent depression mechanisms used in simulations. Before the first stimulus (Prior to S1), autaptic release sites (ovals) had nonuniform release probabilities (numbers inside ovals). With the first stimulus (S1) some sites released (fourth, seventh, and ninth sites fromleft). With short-term synaptic depression, the net efficacy of the synapses was then decreased (Prior to S2). For release-dependent depression (left), the sites that released on S1 had their release probabilities reduced (multiplied by f < 1), whereas other sites were unchanged. For release-independent depression (right), all sites had their release probabilities reduced (multiplied by g < 1).
Fig. 6.
Fig. 6.
Somatic APs. A, In current-clamp mode, current injection at the soma triggered brief APs. Measurement of peak (+35 mV) and half-amplitude width (1.8 msec) is illustrated.B, Four overlaid pairs of APs at varied interstimulus intervals. With pairs of current injections, peak amplitudes were lower and half-amplitude widths were greater for the second AP. C, The peak (left) and half-amplitude width (right) of the second AP recovered toward the values of the first AP with increasing interstimulus intervals. Recovery time courses for both parameters were well fit by single exponentials (solid lines) with the same time constant, 7.3 msec. Data from same cell as in A and B.
Fig. 7.
Fig. 7.
Low doses of TTX reduced AP and EPSC amplitudes, while increasing STD. A, Two pairs of current-clamped APs from the same cell, one in control and the other in 10 nmTTX, illustrating reduction in AP peak amplitudes. B, AP parameters averaged across cells. APs peaked lower and widths were unchanged in TTX. C, Sample EPSCs from a cell with larger-than-average effects of TTX. EPSCs were reduced 79%, and paired-pulse depression was increased from 31 to 62% in this cell.D, Normalized QEPSC averages in control (solid squares) and TTX (open diamonds).Left, Normalized by the first EPSC in control. First EPSCs reduced 38 ± 13% in TTX. Right, Normalized by the first EPSC in each condition, to show increase in STD. Averages across seven cells, p values 0.02–0.12 for stimuli 2–10.
Fig. 8.
Fig. 8.
Expected EPSC variance in two models of release-independent STD. A, Depression attributable to decreasing release probability (PR) at each vesicle release site. Variance fell monotically with decreasing PR when initial PR was constrained to be <0.29 (see Results). Curve plotted according to the binomial variance formula, ς2 = NPR(1 − PR).B, Depression attributable to decreasing action potential conduction probability (PC) through axonal branches. Variance could fall monotically, or rise and then fall with decreasing PC, depending on the number of release sites per axonal branch (SB). Curves plotted according to Equation 2, with PR = 0.29 and initial conduction probability (PC1) constrained to 1. N and q do not affect the normalized variance. C, Depression attributable to decreasing PC with heterogeneity in axonal branch properties. Populations of 500 axonal branches with heterogeneous numbers of sites per branch (SB). SB values were drawn from a normal distribution with mean 30 and SDs between 10 and 30 as labeled. In addition, the rate of decrease in PC was also heterogeneous across branches, with mean 0.2 and SD 0.05 (see Materials and Methods). Mean–variance relations were nearly parabolic, with clear rise and fall in variance with depression of the mean. D, Simplified illustration of depression attributable to reduced release probability. Similar format as in Figure 5D except that all release sites had the same initial release probability. E, Depression attributable to reduced axonal conduction probability at axonal branches. In this illustration, action potential failed to propagate through center branch, effectively removing three release sites. Release probabilities were unchanged at other sites. F, Schematic representation of heterogeneous axonal branch properties. Note range of numbers of release sites per branch and variety in axonal branching complexity. Axonal branching complexity represents one potential mechanism underlying heterogeneous conduction probabilities through terminal branches (see Materials and Methods).
Fig. 9.
Fig. 9.
Experimentally measured EPSC variances during STD.A, Demonstration of acceptance criteria for variance measurements. Seventeen first and second EPSCs (solid diamonds, S1 and open squares,S2) were stable in amplitude over time (dashed lines: slope = 0). EPSCs were 2.7-fold larger in 4 mm Ca2+ plus 100 μm 4-AP, constraining initial PR to <0.37.B, QEPSC variance (ς2) versus QEPSC mean during STD for two representative cells. Left, Clear increase and decrease in variance with STD. Solid line, Fit to Equation 2, the axonal conduction failure formula, with initial conduction probability (PC1) constrained to 1, SB = 8.29, PR = 0.32, NB = 111, and q = −0.038 pC. Data from 16 sweeps.Right, No clear rise in variance with depression. Nonetheless, a better description of the data was provided by Equation2 with PC1 constrained to 1, SB = 6.06, PR = 0.21, NB = 447, and q = −0.042 pC than by the binomial variance formula with N = 809, PRinitially = 0.37, and q = −0.072 pC. Data were from 18 sweeps. C, Average mean–variance relation. For seven cells that met acceptance criteria, both EPSC means and variances derived from 10–18 sweeps per cell were normalized by their initial values and averaged across cells. Equation 2 was fit to these averaged data as detailed in Materials and Methods, with parameters as shown. Multiple linear regression analysis of variance versus mean and mean2 yielded a nearly identical fit, with R2 = 0.866 and p values for coefficients of the mean and mean2 of 3 × 10⁻⁸ and 2.5 × 10⁻⁷, respectively.

References

    1. Abbott LF, Varela JA, Sen K, Nelson SB. Synaptic depression and cortical gain control. Science. 1997;275:220–224. - PubMed
    1. Alger BE, Teyler TJ. Long-term and short-term plasticity in the CA1, CA3, and dentate regions of the rat hippocampal slice. Brain Res. 1976;110:463–480. - PubMed
    1. Allen C, Stevens CF. An evaluation of causes for unreliability of synaptic transmission. Proc Natl Acad Sci USA. 1994;91:10380–10383. - PMC - PubMed
    1. Banker GA, Cowan WM. Further observations on hippocampal neurons in dispersed cell culture. J Comp Neurol. 1979;187:469–493. - PubMed
    1. Barron DH, Matthews B. Intermittent conduction in the spinal cord. J Physiol (Lond) 1935;85:73–103. - PMC - PubMed

Publication types

Grants and funding