

Dietary composition and physiologic adaptations to energy restriction
- PMID: 10731495
- PMCID: PMC2905862
- DOI: 10.1093/ajcn/71.4.901
Dietary composition and physiologic adaptations to energy restriction
Abstract
Background: The concept of a body weight set point, determined predominantly by genetic mechanisms, has been proposed to explain the poor long-term results of conventional energy-restricted diets in the treatment of obesity.
Objective: The objective of this study was to examine whether dietary composition affects hormonal and metabolic adaptations to energy restriction.
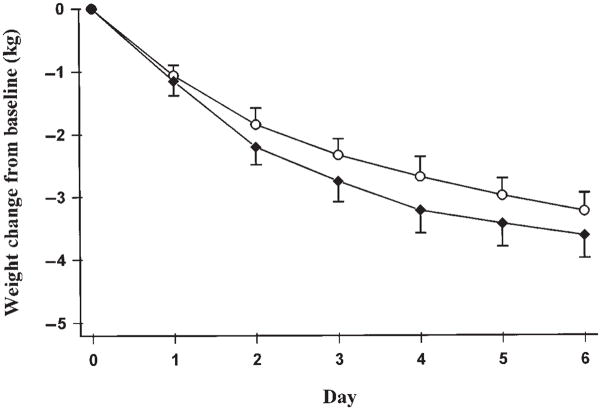
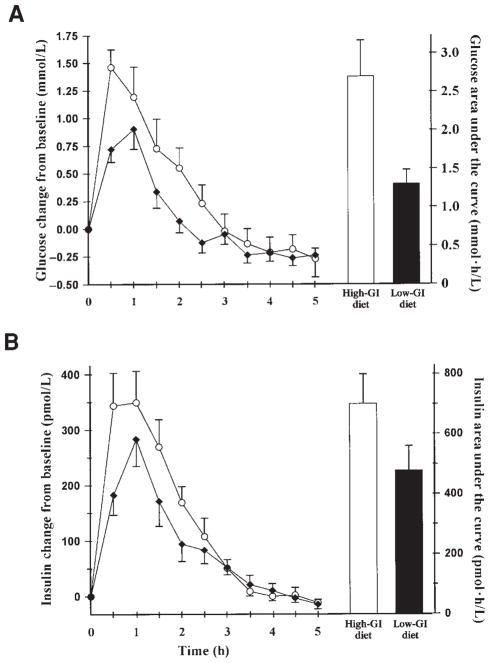
Design: A randomized, crossover design was used to compare the effects of a high-glycemic-index (high-GI) and a low-glycemic-index (low-GI) energy-restricted diet. The macronutrient composition of the high-GI diet was (as percent of energy) 67% carbohydrate, 15% protein, and 18% fat and that of the low-GI diet was 43% carbohydrate, 27% protein, and 30% fat; the diets had similar total energy, energy density, and fiber contents. The subjects, 10 moderately overweight young men, were studied for 9 d on 2 separate occasions. On days -1 to 0, they consumed self-selected foods ad libitum. On days 1-6, they received an energy-restricted high- or low-GI diet. On days 7-8, the high- or low-GI diets were consumed ad libitum.
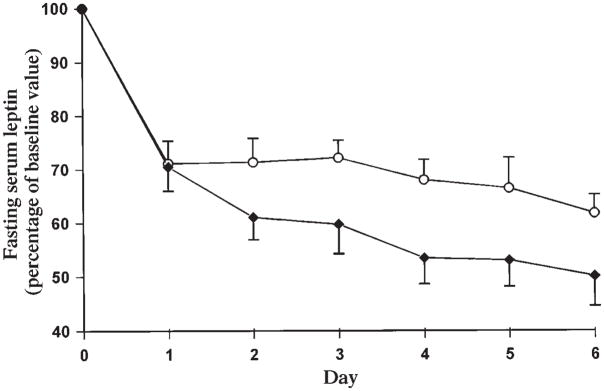
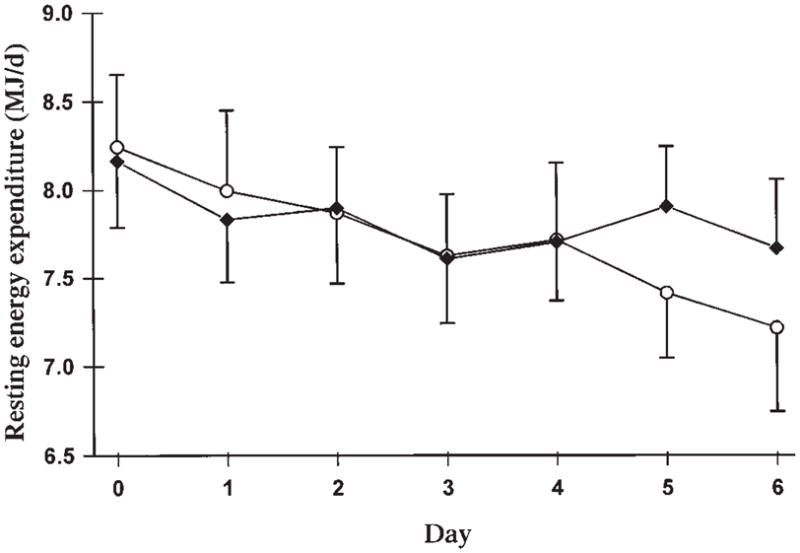
Results: Serum leptin decreased to a lesser extent from day 0 to day 6 with the high-GI diet than with the low-GI diet. Resting energy expenditure declined by 10.5% during the high-GI diet but by only 4.6% during the low-GI diet (7.38 +/- 0.39 and 7.78 +/- 0.36 MJ/d, respectively, on days 5-6; P = 0.04). Nitrogen balance tended to be more negative, and energy intake from snacks on days 7-8 was greater, with the high-GI than the low-GI diet.
Conclusion: Diets with identical energy contents can have different effects on leptin concentrations, energy expenditure, voluntary food intake, and nitrogen balance, suggesting that the physiologic adaptations to energy restriction can be modified by dietary composition.
Figures
References
-
- Troiano RP, Flegal KM. Overweight children and adolescents: description, epidemiology, and demographics. Pediatrics. 1998;101:497–504. - PubMed
-
- Kuczmarski RJ, Carroll MD, Flegal KM, Troiano RP. Varying body mass index cutoff points to describe overweight prevalence among U.S. adults: NHANES III (1988 to 1994) Obes Res. 1997;5:542–8. - PubMed
-
- Wolf AM, Colditz GA. Current estimates of the economic cost of obesity in the United States. Obes Res. 1998;6:97–106. - PubMed
-
- NIH Technology Assessment Conference Panel. Consensus Development Conference, 30 March to 1 April 1992. Methods for voluntary weight loss and control. Ann Intern Med. 1993;119:764–70. - PubMed
-
- Leibel RL, Rosenbaum M, Hirsch J. Changes in energy expenditure resulting from altered body weight. N Engl J Med. 1995;332:621–8. - PubMed
Publication types
MeSH terms
Substances
Grants and funding
LinkOut - more resources
Full Text Sources
Medical