. 2000 Apr;115(4):391-404.
doi: 10.1085/jgp.115.4.391.

Permeation properties of inward-rectifier potassium channels and their molecular determinants

Affiliations

Permeation properties of inward-rectifier potassium channels and their molecular determinants

H Choe et al. J Gen Physiol. 2000 Apr.

Abstract

The structural domains contributing to ion permeation and selectivity in K channels were examined in inward-rectifier K(+) channels ROMK2 (Kir1.1b), IRK1 (Kir2.1), and their chimeras using heterologous expression in Xenopus oocytes. Patch-clamp recordings of single channels were obtained in the cell-attached mode with different permeant cations in the pipette. For inward K(+) conduction, replacing the extracellular loop of ROMK2 with that of IRK1 increased single-channel conductance by 25 pS (from 39 to 63 pS), whereas replacing the COOH terminus of ROMK2 with that of IRK1 decreased conductance by 16 pS (from 39 to 22 pS). These effects were additive and independent of the origin of the NH(2) terminus or transmembrane domains, suggesting that the two domains form two resistors in series. The larger conductance of the extracellular loop of IRK1 was attributable to a single amino acid difference (Thr versus Val) at the 3P position, three residues in front of the GYG motif. Permeability sequences for the conducted ions were similar for the two channels: Tl(+) > K(+) > Rb(+) > NH(4)(+). The ion selectivity sequence for ROMK2 based on conductance ratios was NH(4)(+) (1.6) > K(+) (1) > Tl(+) (0.5) > Rb(+) (0.4). For IRK1, the sequence was K(+) (1) > Tl(+) (0.8) > NH(4)(+) (0.6) >> Rb(+) (0.1). The difference in the NH(4)(+)/ K(+) conductance (1.6) and permeability (0.09) ratios can be explained if NH(4)(+) binds with lower affinity than K(+) to sites within the pore. The relatively low conductances of NH(4)(+) and Rb(+) through IRK1 were again attributable to the 3P position within the P region. Site-directed mutagenesis showed that the IRK1 selectivity pattern required either Thr or Ser at this position. In contrast, the COOH-terminal domain conferred the relatively high Tl(+) conductance in IRK1. We propose that the P-region and the COOH terminus contribute independently to the conductance and selectivity properties of the pore.


Figures

Figure 1
Figure 1
Segmental division of both ROMK and IRK. In each of the four subunits, M1 and M2 are presumed membrane-spanning domains. P denotes the highly conserved (pore) domain. The segments MP and PM are, respectively, the region between M1 and P, and the region between P and M2. The cylinder in the extracellular loop is the pore helix (Doyle et al. 1998), consisting of the first half of the P region with a minor contribution from the MP region. The seven segments of the chimeras are defined in Figure 4 of Choe et al. 1999.
Figure 2
Figure 2
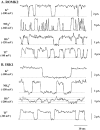
Single-channel current traces of ROMK2, IRK1, and some chimeras at −100 mV in the cell-attached mode. The shaded regions of the rectangles depicting the chimeras are derived from IRK1 and the open regions from ROMK2. The dotted lines indicate the closed state, and upward direction is inward current. The pipette solution contained 110 mM KCl. (A) Conductances of Chm107 and Chm13 are, respectively, larger and smaller than that of ROMK2. (B) Conductance of Chm108 is smaller than that of IRK1.
Figure 3
Figure 3
Conductance (pS) at the voltage range of 0–100 mV. Shaded rectangles correspond to segments from IRK1. Clear rectangles denote segments from ROMK2. Data are means ± SEM (number of measurements).
Figure 4
Figure 4
K+ conductance (pS) of ECL chimeras and mutants in the P region. Data are means ± SEM (number of measurements).
Figure 5
Figure 5
Single-channel current traces of ROMK2 and IRK1 with K+, NH4 +, Rb+, and Tl+ in the pipettes (110 mM) in the cell-attached mode. The dotted lines indicate the closed state, and upward deflections denote inward current. The voltages in parentheses indicate the membrane potentials. The Rb+ currents for IRK1 were recorded from patches with multiple channels.
Figure 6
Figure 6
I-V plots for single channel inward currents of ROMK2, IRK1, Chm25, and Chm107 in the cell-attached mode. Data points and error bars for the four cations in the pipette represent means ± SEM as follows: K+ (○), NH4 + (▴), Rb+ (▵), and Tl+ (•). The dashed lines are averages of linear regressions of individual patches over the following ranges: 0 to −100 mV (K+), −60 to −160 mV (NH4 +), −20 to −120 mV (Rb+ for ROMK2), −20 to −200 mV (Rb+ for IRK1), and 20 to −80 mV (Tl+). The correlation coefficients are (in the order of K, NH4, Rb, and Tl): for ROMK2: 0.997, 0.998, 0.989, and 0.991; for IRK1: 0.989, 0.988, 0.996, and 0.993; for Chm25: 0.987, 0.999, 0.987, and 0.984; for Chm107: 0.996, 0.999, 0.993, and 0.993.
Figure 7
Figure 7
I-V plots for single channel inward currents of Chm8 (ROMK2, L117I, and V121T) and the individual mutants, L117I and V121T, in the cell-attached mode. The symbols and the voltage range for the conductance estimates are the same as in Fig. 6. The correlation coefficients are (in the order of K, NH4, and Rb): for Chm8: 0.994, 0.993, and 0.991; for L117I: 0.997, 0.998, and 0.991; for V121T: 0.997, 0.996, and 0.994.
Figure 8
Figure 8
The 3P position in the crystal structure of the KcsA channel (arrows) is located at the COOH terminus of the pore helix. The 3P residue in KcsA and IRK is Thr; in ROMK it is Val. The KcsA ribbon model was constructed from coordinates downloaded from the PDB database, structure 1BL8. Two of the four subunits are shown for clarity. The symbol for two resistors is superimposed on the channel structure. Note that the model assumes a long cytoplasmic inner resistor that is not observed in the channel structure.
Figure 9
Figure 9
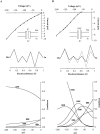
Three-site four-barrier kinetic model. (A, top) Single channel I-V plots for K+ current through ROMK2 channel (110 mM KCl in the pipette in the cell-attached mode). The line is the best-fit to the data using the three-site four-barrier kinetic model, which gives rise to the following rate constants (s−1) (Scheme I). V1, V2, and V3 represent the first, second, and third energy wells from the outside.SCHEME I (Middle) The energy profile for K+ ion along the pore of ROMK2 at 0 mV. The shape of the energy profiles was constructed from the kinetic model. (Bottom) Occupancy plot of each state as a function of voltage for the K+ ion in the pore of ROMK2. The symbol KKK indicates the state that all three energy wells are occupied by K+, and the symbol EKK indicates the state that the second and the third energy wells from outside are occupied by K+. The pore is occupied by at least two K+ ions most of the time. The occupancies of the two states, KKE and EEE, are very small and not shown. (B, top) Single channel I-V plots of ROMK2 with NH4 + (110 mM) outside and K+ (110 mM) inside the cell. The line is the best-fit to the data using the three-site four-barrier kinetic model with the same rate constants as in A for K+. The fitting procedure produced the following kinetic rates for NH4 + (Scheme II).SCHEME II (Middle) The ion energy profile (solid) for NH4 + ion along the pore of ROMK2 at 0 mV, obtained from the kinetic model for NH4 +. The dotted energy profile is for K+ in A for comparison. The energy wells for NH4 + are shallower than those for K+, suggesting weaker affinity for NH4 +. (Bottom) Occupancy plot of each state as a function of voltage in the pore of ROMK2 with NH4 + outside and K+ inside. The symbol NNN means that all three sites are occupied by NH4 +, and the symbol NEK means that the outer and inner wells are occupied by NH4 + and K+, respectively. States with small occupancies are not shown for clarity.
None
None

References

    1. Abrams C.J., Davies N.W., Shelton P.A., Stanfield P.R. The role of a single aspartate residue in ionic selectivity and block of a murine inward rectifier K+ channel Kir2.1. J. Physiol. 1996;493:643–649. - PMC - PubMed
    1. Armstrong C.M. Inactivation of the potassium conductance and related phenomena caused by quaternary ammonium ion injection in squid axons. J. Gen. Physiol. 1969;54:553–575. - PMC - PubMed
    1. Armstrong C.M. Interaction of tetraethylammonium ion derivatives with the potassium channels of giant axons. J. Gen. Physiol. 1971;58:413–437. - PMC - PubMed
    1. Ashcroft F.M., Stanfield P.R. The influence of the permeant ions thallous and potassium on inward rectification in frog skeletal muscle. J. Physiol. 1983;343:407–428. - PMC - PubMed
    1. Begenisich T.B., Cahalan M.D. Sodium channel permeation in squid axons. IReversal potential experiments. J. Physiol. 1980;307:217–242. - PMC - PubMed

Publication types

MeSH terms

LinkOut - more resources