. 2000 Apr;115(4):467-80.
doi: 10.1085/jgp.115.4.467.

Functional impact of the ryanodine receptor on the skeletal muscle L-type Ca(2+) channel

Affiliations

Functional impact of the ryanodine receptor on the skeletal muscle L-type Ca(2+) channel

G Avila et al. J Gen Physiol. 2000 Apr.

Abstract

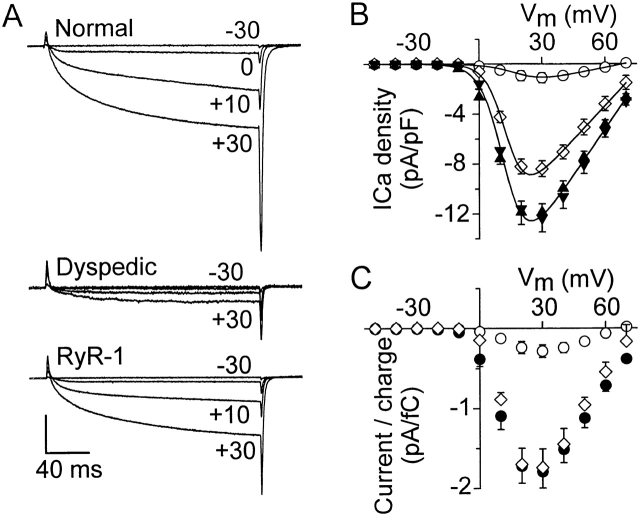
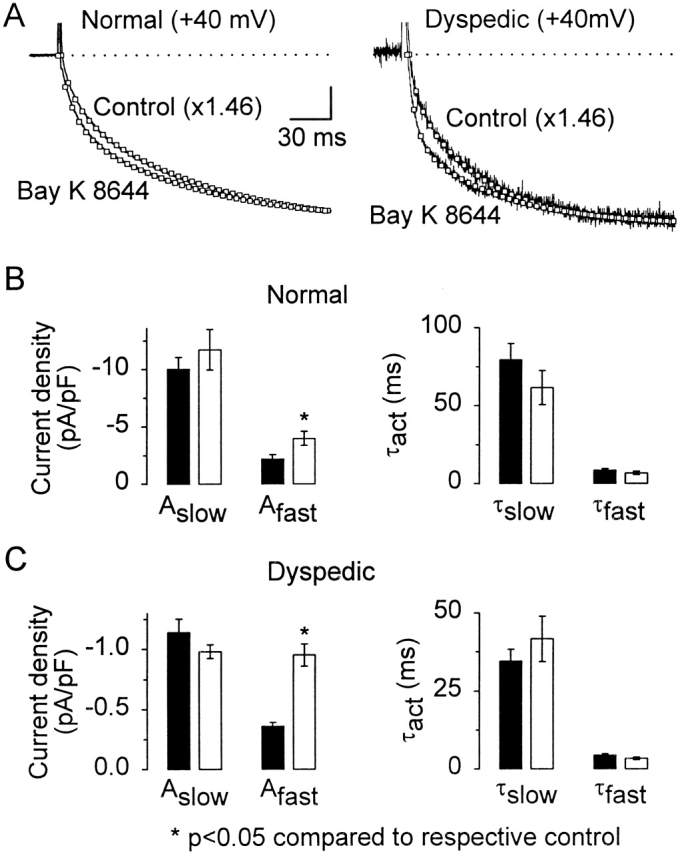
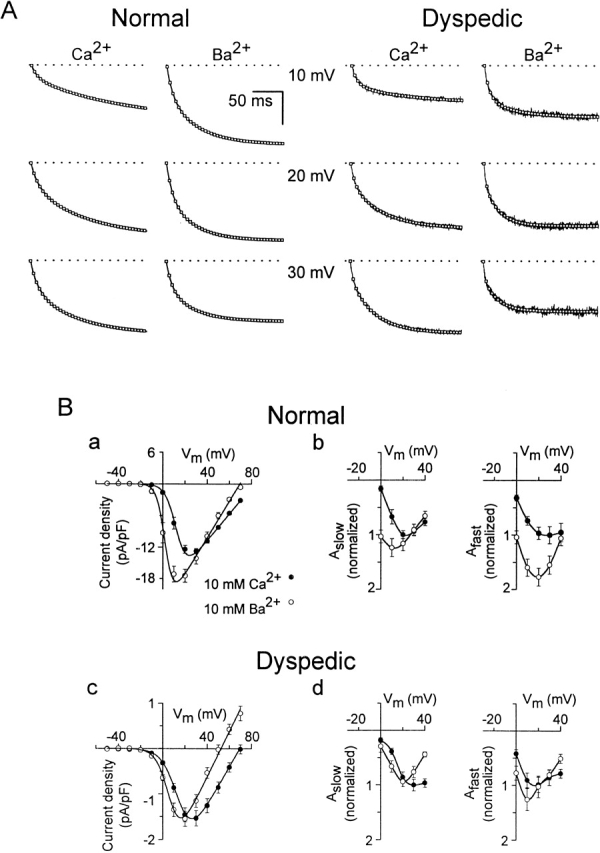
L-type Ca(2+) channel (L-channel) activity of the skeletal muscle dihydropyridine receptor is markedly enhanced by the skeletal muscle isoform of the ryanodine receptor (RyR1) (Nakai, J., R.T. Dirksen, H. T. Nguyen, I.N. Pessah, K.G. Beam, and P.D. Allen. 1996. Nature. 380:72-75.). However, the dependence of the biophysical and pharmacological properties of skeletal L-current on RyR1 has yet to be fully elucidated. Thus, we have evaluated the influence of RyR1 on the properties of macroscopic L-currents and intracellular charge movements in cultured skeletal myotubes derived from normal and "RyR1-knockout" (dyspedic) mice. Compared with normal myotubes, dyspedic myotubes exhibited a 40% reduction in the amount of maximal immobilization-resistant charge movement (Q(max), 7.5 +/- 0.8 and 4.5 +/- 0.4 nC/muF for normal and dyspedic myotubes, respectively) and an approximately fivefold reduction in the ratio of maximal L-channel conductance to charge movement (G(max)/Q(max)). Thus, RyR1 enhances both the expression level and Ca(2+) conducting activity of the skeletal L-channel. For both normal and dyspedic myotubes, the sum of two exponentials was required to fit L-current activation and resulted in extraction of the amplitudes (A(fast) and A(slow)) and time constants (tau(slow) and tau(fast)) for each component of the macroscopic current. In spite of a >10-fold in difference current density, L-currents in normal and dyspedic myotubes exhibited similar relative contributions of fast and slow components (at +40 mV; A(fast)/[A(fast) + A(slow)] approximately 0.25). However, both tau(fast) and tau(slow) were significantly (P < 0.02) faster for myotubes lacking the RyR1 protein (tau(fast), 8.5 +/- 1.2 and 4.4 +/- 0.5 ms; tau(slow), 79.5 +/- 10.5 and 34.6 +/- 3.7 ms at +40 mV for normal and dyspedic myotubes, respectively). In both normal and dyspedic myotubes, (-) Bay K 8644 (5 microM) caused a hyperpolarizing shift (approximately 10 mV) in the voltage dependence of channel activation and an 80% increase in peak L-current. However, the increase in peak L-current correlated with moderate increases in both A(slow) and A(fast) in normal myotubes, but a large increase in only A(fast) in dyspedic myotubes. Equimolar substitution of Ba(2+) for extracellular Ca(2+) increased both A(fast) and A(slow) in normal myotubes. The identical substitution in dyspedic myotubes failed to significantly alter the magnitude of either A(fast) or A(slow). These results demonstrate that RyR1 influences essential properties of skeletal L-channels (expression level, activation kinetics, modulation by dihydropyridine agonist, and divalent conductance) and supports the notion that RyR1 acts as an important allosteric modulator of the skeletal L-channel, analogous to that of a Ca(2+) channel accessory subunit.


Figures

Figure 1
Figure 1
Voltage dependence of charge movements. (A) Intramembrane charge movements recorded from normal (top), dyspedic (middle), and RyR1-expressing dyspedic (bottom) myotubes. The recordings for each data set were elicited by 20-ms depolarizations to the indicated voltages (mV). (B) Average voltage dependence of charge movements (Qon) obtained from 17 normal (•), 14 dyspedic (○) and 7 RyR1-expressing dyspedic (⋄) myotubes. Values of Qon were determined by integrating the “on” outward transient at each membrane potential and normalized to cell capacitance (Cm). The average values (±SEM) for the parameters obtained by fitting each myotube within a group separately to are given in Table . The smooth solid lines through the data were generated by using and the average values (Q-V) given in Table . (C) The Qon values from B were normalized to their maximal value and plotted versus Vm.
Figure 2
Figure 2
Voltage dependence of L-currents. (A) Family of calcium currents recorded from normal (top), dyspedic (middle), and RyR-1-expressing (bottom) dyspedic myotubes. The currents were elicited by 200-ms depolarizations from −50 mV to the indicated potential (mV) following a prepulse protocol (see methods) used to inactivate T-type Ca2+ currents. Vertical calibration corresponds to 6 pA/pF for the normal and RyR1-expressing myotubes and 2 pA/pF for the dyspedic myotube. (B) Average peak current density plotted as a function of membrane potential (Vm). Data were obtained from 13 RyR1 homozygous (+/+) (▴), 14 RyR1 heterozygous (+/−) (▾), 9 dyspedic (○), and 6 RyR1-expressing dyspedic (⋄) myotubes. The average values (±SEM) for the parameters obtained by fitting each myotube within a group separately to are given in Table . The smooth solid lines through the data were generated by using and the average values (I-V) given in Table . Data for homozygous (+/+) and heterozygous (+/−) normal myotubes were each well represented by a single solid line obtained from the combined data (13 +/+ and 14 +/− myotubes). (C) Normal and RyR1-expressing dyspedic myotubes exhibit similar average current-to-charge ratios. Current-to-charge ratios were calculated by dividing the peak calcium current at each membrane potential by the maximum immobilization-resistant charge movement (Qmax) that was determined for each myotube. Data were obtained from 17 normal (•, 10 +/+ and 7 +/−), 9 dyspedic (○), and 6 RyR1-expressing dyspedic (⋄) myotubes.
Figure 3
Figure 3
L-currents are best described by the sum of two exponential equations. (A) A representative calcium current (top) is illustrated for a normal myotube after 200-ms depolarizations to +40 mV. L-current activation was fitted according to either first (left) or second (right) order exponential functions (□), as described in methods. The amplitudes and time constants obtained from the single-order exponential fitting was 9.26 pA/pF and 61.4 ms. Second-order exponential fitting resulted in the following values: Aslow = 8.10 pA/pF, τslow = 96.2 ms, Afast = 2.97 pA/pF, and τfast = 10.4 ms. (Bottom) Semilogarithmic plots of the calcium current trace normalized to the peak current superimposed with the results of either a first (left) or second (right) order exponential fit (□). The semilogarithmic plots demonstrate that an adequate description of current activation clearly requires two distinct exponential components (with time constants, τfast and τslow). (B–D) Average parameters obtained from second-order exponential fitting of L-currents obtained at +40 mV. Bars represent the average values from a total of six normal (N), seven dyspedic (Y), and eight RyR1-expressing dyspedic (R) myotubes. Data are shown for (B) current density, (C) relative amplitude (shown as Ax/[Afast + Aslow], where “Ax” represents the absolute steady state amplitude of either the fast or slow components), and (D) the time constants associated with the fast (τfast) and slow (τslow) components of the total current.
Figure 4
Figure 4
Effects of DHP agonist on the two components of macroscopic L-current. (A) Representative L-currents recorded from a normal (left) and a dyspedic (right) myotube in the absence (control) and presence of 5 μM (−) Bay K 8644. Current traces were fitted according to a second-order exponential function (□, superimposed over raw data). Both control traces have been scaled (1.46×) to the peak of the L-current recorded in the presence of DHP. The vertical calibration corresponds to 3 and 0.3 pA/pF for the normal and dyspedic L-current traces recorded in the presence of DHP, respectively. (B) Average values obtained for current density (left) and τact (right) obtained from second-order exponential fitting of data obtained at +40 mV. Data were tabulated from the analysis of calcium currents that were recorded in the absence (black bars) and presence (white bars) of 5 μM (−) Bay K 8644. Values represent means ± SEM of six experiments in normal myotubes and seven experiments in dyspedic myotubes. (−) Bay K 8644 selectively augmented the fast amplitude (Afast) component in both normal (∼1.8-fold) and dyspedic (∼2.7-fold) myotubes, without significantly altering τfast or τslow.
Figure 5
Figure 5
Voltage dependence of the stimulatory effects of DHP agonist on the fast and slow components of macroscopic L-current. Average L-current–voltage relationships obtained from six normal (A) and seven dyspedic (C) myotubes in the absence (•) and presence (○) of 5 μM (−) Bay K 8644. (B and D) Afast and Aslow were determined for current traces from 0 to +40 mV (see methods) and normalized to their maximal value obtained in the absence of DHP. Normalized Afast and Aslow values were then plotted as a function of membrane potential (Vm). Absolute peak values for the two components of the calcium current in the absence of DHP were (pA/ pF): Aslow = 11.89 ± 1.10, Afast = 2.30 ± 0.40 for normal myotubes, and Aslow = 1.23 ± 0.16, Afast = 0.47 ± 0.06 for dyspedic myotubes. Neither τfast nor τslow were significantly altered by 5 μM (−) Bay K 8644 at any potential (data not shown).
Figure 6
Figure 6
Voltage dependence of the effects of divalent charge carrier on the fast and slow components of macroscopic L-current. (A) Representative L-currents recorded from a normal (left) and dyspedic (right) myotube obtained in the presence of either 10 mM extracellular Ca2+ (Ca2+) or 10 mM extracellular Ba2+ (Ba2+). Current traces were fitted according to a second-order exponential function (□, superimposed over raw data). The vertical calibration corresponds to 2.5 and 0.5 nA for the normal and dyspedic myotubes, respectively. (B) L-current–voltage relationships from 11 normal (a) and seven dyspedic (c) myotubes recorded as in A. Aslow and Afast values (b and d) were obtained and normalized as described in Fig. 5. Absolute peak values for the two components of the calcium current were (pA/ pF): Aslow = 10.89 ± 0.80, Afast = 2.28 ± 0.36 for normal myotubes, and Aslow = 1.12 ± 0.12, Afast = 0.47 ± 0.07 for dyspedic myotubes.

References

    1. Adams B.A., Beam K.G. A novel calcium current in dysgenic skeletal muscle. J. Gen. Physiol. 1989;94:429–444. - PMC - PubMed
    1. Adams B.A., Tanabe T., Mikami A., Numa S., Beam K.G. Intramembrane charge movement restored in dysgenic skeletal muscle by injection of dihydropyridine receptor cDNAs. Nature. 1990;346:569–572. - PubMed
    1. Armstrong C.M., Bezanilla F.M., Horowicz P. Twitches in the presence of ethylene glycol bis(-aminoethyl ether)-N,N′-tetraacetic acid. Biochim. Biophys. Acta. 1972;267:605–608. - PubMed
    1. Beurg M., Sukhareva M., Ahren C.A., Conklin M.W., Perez-Reyes E., Powers P.A., Gregg R.G., Coronado R. Differential regulation of skeletal muscle L-type Ca2+ current and excitation–contraction coupling by the dihydropyridine receptor β1 subunit. Biophys. J. 1999;76:1744–1756. - PMC - PubMed
    1. Beurg M., Sukhareva M., Strube C., Powers P.A., Gregg R.G., Coronado R. Recovery of Ca2+ current, charge movements, and Ca2+ transients in myotubes deficient in dihydropyridine receptor β1 subunit transfected with β1 cDNA. Biophys. J. 1997;73:807–818. - PMC - PubMed

Publication types

MeSH terms

Substances