. 2000 Apr;115(4):481-90.
doi: 10.1085/jgp.115.4.481.

Dual regulation of calcium mobilization by inositol 1,4, 5-trisphosphate in a living cell

Affiliations

Dual regulation of calcium mobilization by inositol 1,4, 5-trisphosphate in a living cell

S Tertyshnikova et al. J Gen Physiol. 2000 Apr.

Abstract

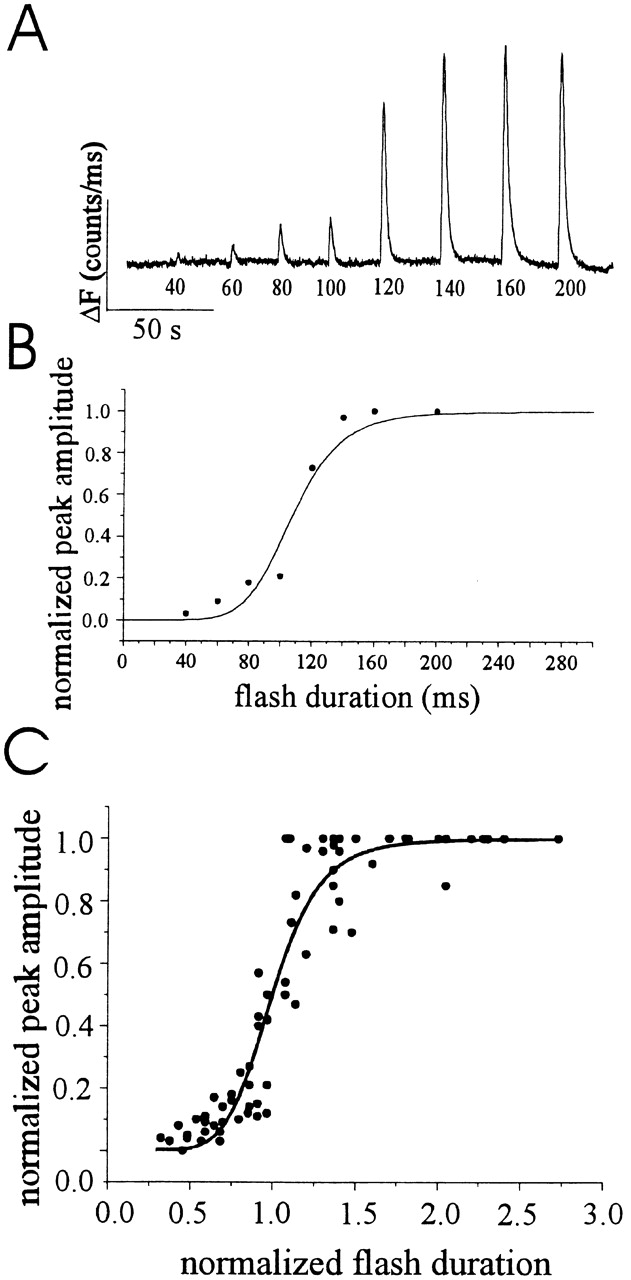
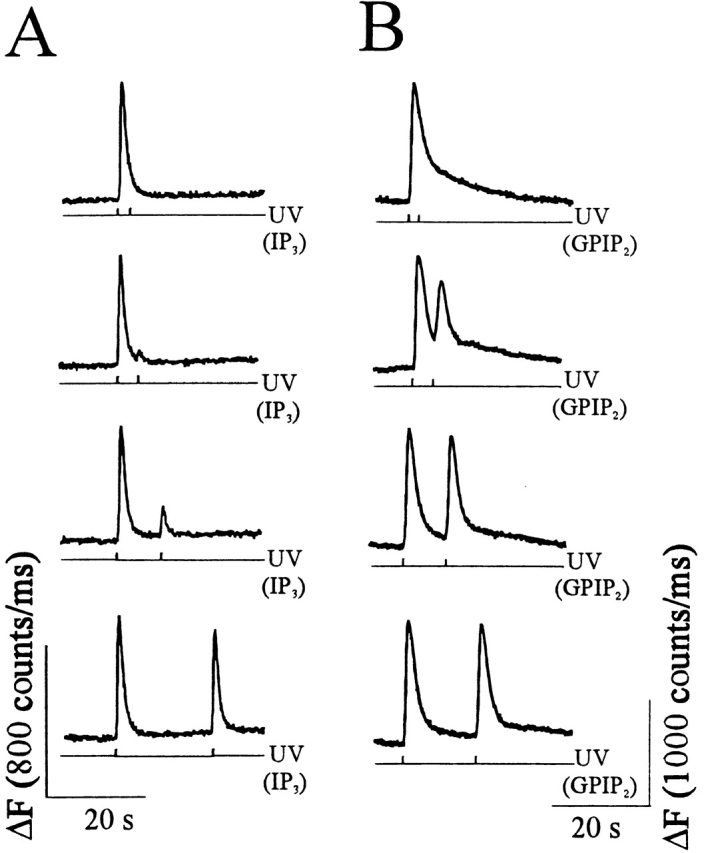
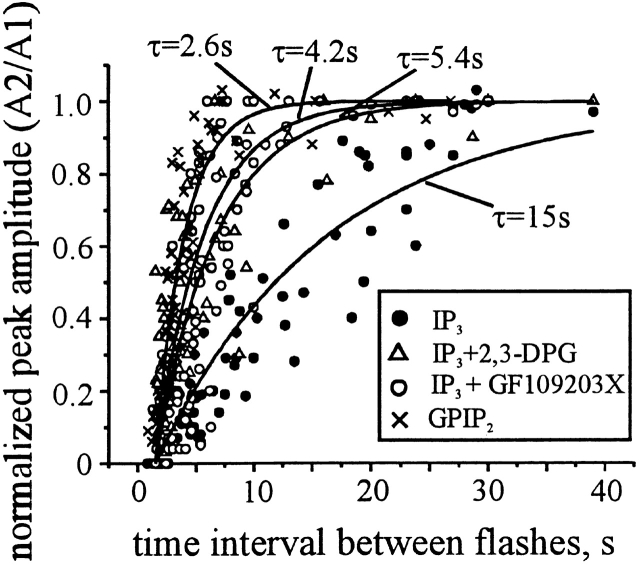
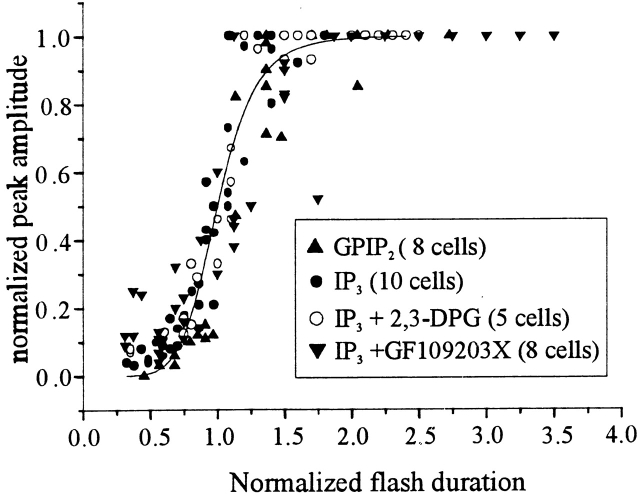
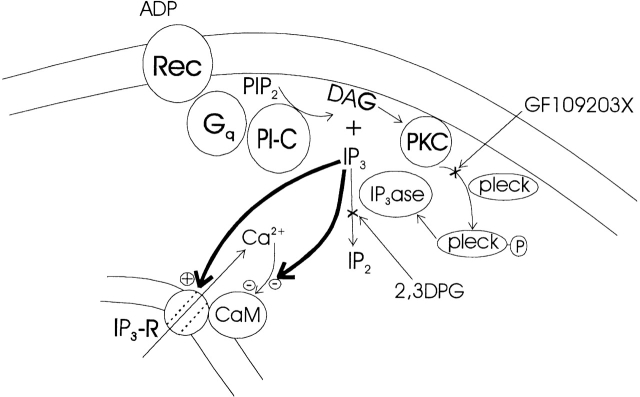
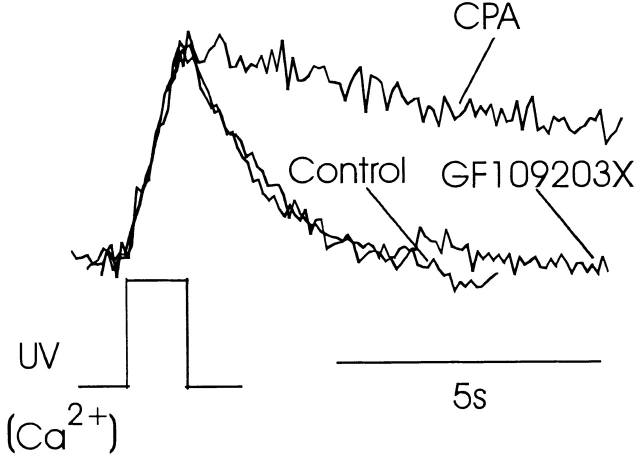
Changes in cytosolic free calcium ([Ca(2+)](i)) often take the form of a sustained response or repetitive oscillations. The frequency and amplitude of [Ca(2+)](i) oscillations are essential for the selective stimulation of gene expression and for enzyme activation. However, the mechanism that determines whether [Ca(2+)](i) oscillates at a particular frequency or becomes a sustained response is poorly understood. We find that [Ca(2+)](i) oscillations in rat megakaryocytes, as in other cells, results from a Ca(2+)-dependent inhibition of inositol 1,4,5-trisphosphate (IP(3))-induced Ca(2+) release. Moreover, we find that this inhibition becomes progressively less effective with higher IP(3) concentrations. We suggest that disinhibition, by increasing IP(3) concentration, of Ca(2+)-dependent inhibition is a common mechanism for the regulation of [Ca(2+)](i) oscillations in cells containing IP(3)-sensitive Ca(2+) stores.


Figures

Figure 1
Figure 1
Dose–response curve for IP3-mediated Ca2+ release. (A) IP3-mediated [Ca2+]i response for UV flashes of increasing duration. Caged IP3 (100 μM) and OGB488 (200 μM) were included in the patch pipette solution. (B) Normalized peak amplitude (R/R max) of the IP3-mediated [Ca2+]i response for the data in A as a function of the flash duration, where R max is the maximum peak amplitude observed. (C) Normalized peak amplitude (R/R max) of the IP3-mediated [Ca2+]i response for 10 cells as a function of the normalized flash duration. The data in B and C are well fit with the Hill equation R/R max = 1/[1 + (d 1/2/d)n], with n = 7, where d 1/2 is the flash duration that gives a peak response of 1/2 the maximum amplitude. (B) d 1/2 = 108 ms, (C) d 1/2 = 1.
Figure 2
Figure 2
Paired pulse experiment to measure recovery from desensitization in rat megakaryocytes loaded with either caged-IP3 or -GPIP2. In each trace of A and B, the rise in [Ca2+]i was monitored by measuring OGB488 fluorescence intensity and is expressed as ΔF (counts/millisecond). For each trace in A and B, the cell was stimulated by two flashes of UV light, which released IP3 in A and GPIP2 in B. For the cell in A, 100 μM caged IP3 and 200 μM OGB488 were included in the patch pipette solution. For the cell in B, 100 μM caged GPIP2 and 200 μM OGB488 were included in the patch pipette solution. See methods for further experimental details.
Figure 3
Figure 3
Time course of recovery from desensitization in rat megakaryocytes loaded with either caged IP3 or GPIP2. The data points were obtained from paired-pulse experiments similar to those in Fig. 2. Each data point represents the ratio (A2/A1) of the peak amplitude of the response to the second pulse of IP3 (A2) to the peak amplitude of the response to the first pulse of IP3 (A1) as a function of the time interval between the pulses (Fig. 2). We used 10 mM 2,3-DPG and 10 μM GF109203X in these experiments. Although a concentration of 10 mM for 2,3-DPG may seem high, it is actually quite reasonable as the K i for inhibition of IP3-5-phosphatase is in the millimolar range (for example, the K i = 4 mM in squid photoreceptors; Wood et al. 1990). See methods for further experimental details and the text for an explanation of the solid curves and the τ values associated with them.
Figure 4
Figure 4
Dose–response curve for GPIP2-mediated Ca2+ release and IP3-mediated Ca2+ release in the presence of 2,3-DPG or GF109203X. OGB488 (200 μM) together with either caged IP3 (100 μM) or GPIP2 (100 μM) were included in the patch pipette solution. We used 10 mM 2,3-DPG and 10 μM GF109203X in these experiments. As in Fig. 1 C, we plot the normalized peak amplitude (R/R max) of the IP3- or GPIP2-mediated [Ca2+]i response as a function of the normalized flash duration, where R max is the maximum peak amplitude of the [Ca2+]i response. Also included in this figure is the data from Fig. 1 C. The data are well fit with the Hill equation R/R max = 1/[1 + (d 1/2/d)n], with n = 7 and d 1/2 = 1.
Figure 6
Figure 6
Effect of the PKC inhibitor, GF109203X, on ADP-induced [Ca2+]i oscillations in a rat megakaryocyte. Changes in [Ca2+]i were monitored by measuring OGB488 fluorescence intensity and are expressed as ΔF (counts/millisecond). GF109203X (15 μM) and ADP (100 μM) were applied to the cell via the local superfusion system. The cell was loaded with OGB488 using the cell permeable AM ester of OGB488. Similar results were seen in five other cells. See methods for further experimental details.
Figure 5
Figure 5
Comparison of the time course of the [Ca2+]i response to the uncaging of IP3 or GPIP2 in rat megakaryocytes. Flashes of 150-, 300-, 1,000-, and 2,000-ms duration were used for uncaging with each cell. Changes in [Ca2+]i were monitored by measuring OGB488 fluorescence intensity and are expressed as ΔF (counts/millisecond). Results similar to those shown were seen in two other cells each.
Figure 9
Figure 9
Simplified diagram illustrating disinhibition of Ca2+-dependent inhibition of IP3-mediated Ca2+ release with higher IP3 concentrations (heavy arrow). ADP is shown as activating phospholipase C (Pl-C) via the GTP-binding protein (Gq) to form diacylglycerol (DAG) and IP3. IP3 is shown as causing the release of Ca2+ (heavy arrow) and DAG is shown as activating PKC, which in turn phosphorylates pleckstrin (pleck). Phosphorylated pleckstrin is shown as activating the IP3-5 phosphatase (IP3ase), which inactivates IP3 by hydrolyzing it to inositol 1,4-bisphosphate (IP2). GF109203X and 2,3DPG are shown as inhibiting PKC and the IP3ase, respectively. Released Ca2+ is shown as feeding back via calmodulin (CaM) to inhibit further release of Ca2+ by the IP3-R.
Figure 7
Figure 7
The PKC inhibitor GF109203X does not affect the rate of calcium removal from the cytoplasm. The cell was loaded with caged Ca2+ and OGB488 using the cell-permeant forms of each molecule as described in methods. [Ca2+]i spikes resulting from photorelease of caged Ca2+ are shown superimposed for the purpose of comparison. GF 109203X had no effect on the time course of the fall in [Ca2+]i after photolysis of caged-Ca2+. Cyclopiazonic acid (CPA) was applied to the cell to serve as a positive control for inhibition of Ca2+ sequestration. GF109203X (30 μM) and CPA (5 μM) were applied to the cell via the local superfusion system as described in methods.
Figure 8
Figure 8
Elevation of [Ca2+]i resulting from multiple flashes that photorelease caged IP3 or GPIP2. (A) Caged IP3, (B) caged IP3 in the presence of 10 mM 2,3-DPG, (C) caged GPIP2, and (D) caged IP3 in the presence of 5 μM GF109203X. Either caged IP3 (100 μM) and OGB488 (200 μM), or caged GPIP2 (100 μM) and OGB488 (200 μM) were included in the patch-pipette solution. The cell in A was stimulated with 11 flashes spaced 1.8-s apart, the cell in B was stimulated with 6 flashes spaced 3.6-s apart, the cell in C was stimulated with 16 flashes spaced 1.2-s apart, and the cell in D was stimulated with 11 flashes spaced 1.2-s apart. Similar results as those in A–D were seen in at least three to five other cells each.

Similar articles

Cited by

References

    1. Auethavekiat V., Abrams C.S., Majerus P.W. Phosphorylation of platelet pleckstrin activates inositol polyphosphate 5-phosphatase I. J. Biol. Chem. 1997;272:1786–1790. - PubMed
    1. Benevolensky D., Moraru I.I., Watras J. Micromolar calcium decreases affinity of inositol trisphosphate receptor in vascular smooth muscle. Biochem. J. 1994;299:631–636. - PMC - PubMed
    1. Berridge M.J., Bootman M.D., Lipp P. Calcium—a life and death signal. Nature. 1998;395:645–648. - PubMed
    1. Berven L.A., Barritt G.J. A role for a pertussis toxin–sensitive trimeric G-protein in store-operated Ca2+ inflow in hepatocytes. FEBS Lett. 1994;346:235–240. - PubMed
    1. Bezprozvanny I., Watras J., Ehrlich B.E. Bell-shaped calcium-response curves of Ins(1,4,5)P3- and calcium-gated channels from endoplasmic reticulum of cerebellum. Nature. 1991;351:751–754. - PubMed

MeSH terms