. 2000 Mar 28;97(7):3718-23.
doi: 10.1073/pnas.97.7.3718.

Random GFP::cDNA fusions enable visualization of subcellular structures in cells of Arabidopsis at a high frequency

Affiliations

Random GFP::cDNA fusions enable visualization of subcellular structures in cells of Arabidopsis at a high frequency

S R Cutler et al. Proc Natl Acad Sci U S A. .

Abstract

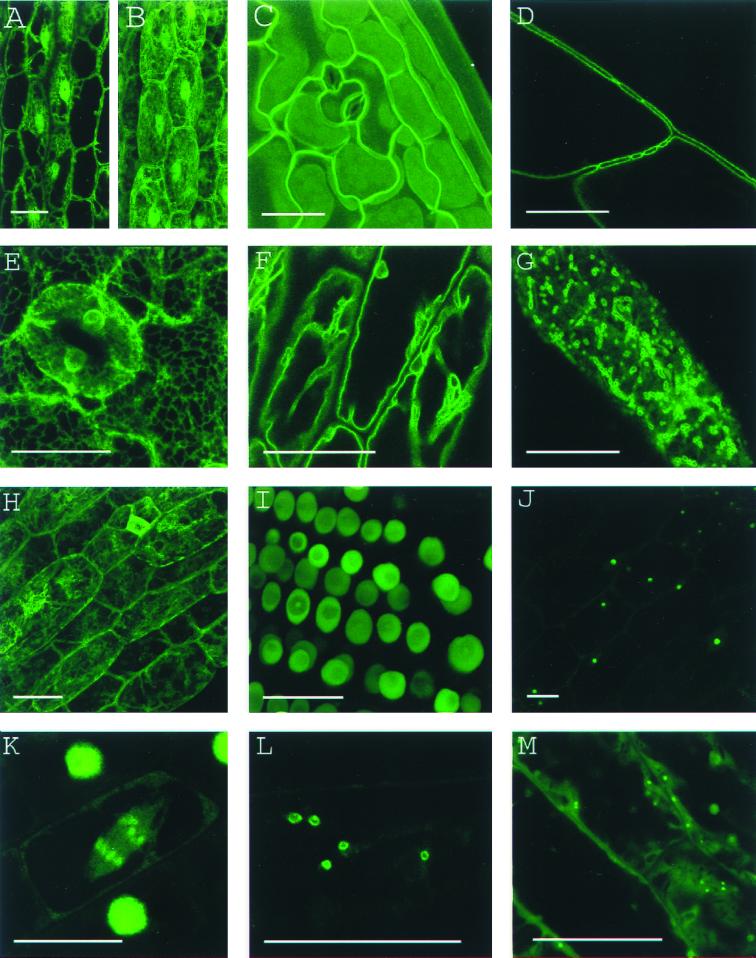
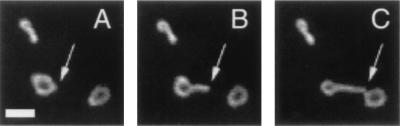
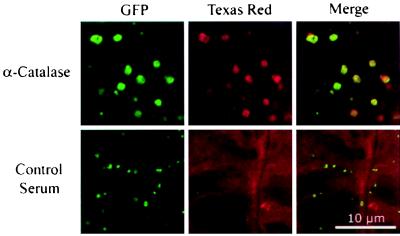
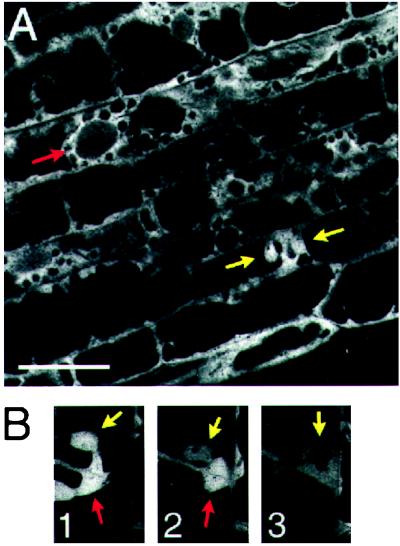
We describe a general approach for identifying components of subcellular structures in a multicellular organism by exploiting the ability to generate thousands of independent transformants in Arabidopsis thaliana. A library of Arabidopsis cDNAs was constructed so that the cDNAs were inserted at the 3' end of the green fluorescent protein (GFP) coding sequence. The library was introduced en masse into Arabidopsis by Agrobacterium-mediated transformation. Fluorescence imaging of 5,700 transgenic plants indicated that approximately 2% of lines expressed a fusion protein with a different subcellular distribution than that of soluble GFP. About half of the markers identified were targeted to peroxisomes or other subcellular destinations by non-native coding sequence (i.e., out-of-frame cDNAs). This observation suggests that some targeting signals are of sufficiently low information content that they can be generated frequently by chance. The potential of the approach for identifying markers with unique dynamic processes is demonstrated by the identification of a GFP fusion protein that displays a cell-cycle regulated change in subcellular distribution. Our results indicate that screening GFP-fusion protein libraries is a useful approach for identifying and visualizing components of subcellular structures and their associated dynamics in higher plant cells.


Figures

Figure 1
Figure 1
Canonical images of marker classes. (A and B) Wild type: Hypocotyl epidermal cells of transgenic seedlings expressing pEGAD GFP; nuclei and cytoplasmic strands are evident. Shown for comparison are a single confocal optical section (A) and a brightest point projection of several optical sections (B) of the same plant cells. (C) Cell surface: Cotyledon epidermal cells of EGAD line Q8, which expresses a GFP fusion to the plasma membrane channel protein PIP2A. In plasmolysis experiments, GFP fluorescence associates with the membrane of plasmolysed cells, indicating the marker is not cell wall localized. (D) Cell contact junctions: Leaf petiole epidermal cells in line LEEZ, which expresses an out-of-frame fusion protein. Markers of this class highlight both plasma membranes and membrane contact zones. Contact zones are specific to the “cell contact junction group” and are not observed in members of the cell surface group. (E) Endoplasmic reticulum: Cotyledon epidermal cells in line Q4, which express an in-frame fusion to a predicted protein containing a carboxy terminal membrane anchor rich in lysine residues. This marker colocalizes with fluorescent BODIPY-Ceramide, an endoplasmic reticulum (ER) membrane marker dye (data not shown), and is similar in appearance to KDEL-tagged GFP (20). (F) Vacuolar membrane: Hypocotyl epidermal cells in line Q5, which expresses a fusion to delta-TIP, a vacuolar membrane channel protein. Vacuolar membrane encasing trans-vacuolar cytosolic strands and invaginations creates a complicated pattern of fluorescence. The vacuolar membrane can be seen to flow over organelles at the cell periphery (see supplemental data) (G) Tiny bubbles: Hypocotyl epidermal cell of line Q10, which expresses a fusion protein to a novel glycine rich protein. In addition to the bubble-like structures, a reticulate ER-like pattern is also faintly marked in this line. The identity of the bubble-like structures is unknown but may be ER associated (see supplemental data). (H) Nuclear exclusion. Line Q1 expresses a fusion protein to a predicted small acidic ribosomal protein. Markers in this group do not show the nuclear localization characteristic of wild-type GFP (see B). (I) Nuclear: Root meristem cells in line N7, which expresses a GFP fusion to a transcription factor-like protein. (J) Nucleolar: Hypocotyl epidermal cells in line expressing a fusion protein targeted to the nucleus (K). Chromosomes: A dividing root cell in line M253, showing accumulation of the GFP∷CRY2 fusion protein on anaphase chromosomes. Before mitosis, the marker appears to localize to the nuclear lumen, as seen in several adjacent cells. These interphase nuclei are overexposed to better show the chromosomal pattern in the dividing cell. (L) Q-balls. Shown are structures of unknown identity illuminated by an out-of-frame fusion protein, F2. (M) Streaming dots: Hypocotyl cell of EGAD line V6, which expresses a fusion to an EST of unknown function. The images shown in BE and GI are brightest-point projections of confocal Z-series. The remaining images are single optical sections acquired by using confocal microscopy. (Bars = 20 μm.)
Figure 2
Figure 2
Dynamics of torus marker. Sequential images were acquired at 0.75-second intervals from a hypocotyl cell of EGAD line C2, which expresses an out-of-frame fusion protein. The time series shows a Torus structure adopting a tubular morphology (marked by an arrow). (Bar = 1 μM.)
Figure 3
Figure 3
Torus structures react with an antibody directed against a peroxisomal protein. Shown are confocal images of whole-mount Arabidopsis seedling tissue probed with anticatalase serum (catalase, upper row) and serum from a control rabbit (serum control, lower row). EGFP fluorescence was detected at 510–532 nm with excitation at 488 nm (GFP, shown in green pseudocolor). Texas Red-conjugated secondary antibody was detected at 595–615 nm with excitation at 568 nm (Texas Red, shown in red pseudocolor). Correspondence of the fluorescence patterns is shown in color-merged images (Merged).
Figure 4
Figure 4
GFP∷GF14 shows dynamic nuclear localization. (A) Confocal image of hypocotyl cells expressing GFP∷GF14. GFP∷GF14 localizes to the nuclei of cells undergoing cytokinesis (yellow arrows) but not to the nuclei of most interphase cells (red arrow). (B) Confocal time series of hypocotyl cell undergoing cytokinesis. GFP∷GF14 accumulates in the nuclear lumen early in cytokinesis (1, yellow arrow) and dissipates as cytokinesis proceeds (2 and 3, yellow arrows). Part of the phragmosome, the site of synthesis of the new cell wall, is visible as a mass of cytosolic fluorescence (red arrows). Note that the intensity of signal decreases in the nucleus, but fluorescence remains relatively constant in the cytoplasm at the periphery of the cell. The phragmosome, brightly labeled at the start of the sequence, dissipates by the third frame. The frames were acquired at t = 0, 17, and 22 min, respectively. (Bar = 20 microns.)

References

    1. Chalfie M, Tu Y, Euskirchen G, Ward W W, Prasher D C. Science. 1994;263:802–805. - PubMed
    1. Tsien R Y. Annu Rev Biochem. 1998;67:509–544. - PubMed
    1. Cubitt A B, Heim R, Adams S R, Boyd A E, Gross L A, Tsien R Y. Trends Biochem Sci. 1995;20:448–455. - PubMed
    1. Sawin K, E, Nurse P. Proc Natl Acad Sci USA. 1996;93:15146–15151. - PMC - PubMed
    1. Rolls M M, Stein P A, Taylor S S, Ha E, McKeon F, Rapoport T A. J Cell Biol. 1999;146:29–43. - PMC - PubMed

Publication types

Associated data