

doi: 10.1128/AEM.66.4.1706-1710.2000.
Significance of inoculum size in the lag time of Listeria monocytogenes
Affiliations
- PMID: 10742265
- PMCID: PMC92046
- DOI: 10.1128/AEM.66.4.1706-1710.2000
Item in Clipboard
Significance of inoculum size in the lag time of Listeria monocytogenes
Appl Environ Microbiol.
2000 Apr.
Abstract
The lag time of Listeria monocytogenes growing under suboptimal conditions (low nutrient concentrations, pH 6, and 6.5 degrees C) was extended when the inoculum was severely stressed by starvation and the inoculum size was very small. Predictive microbiology should deal with bacterial stress and stochastic approaches to improve its value for the agro-food industry.
Figures
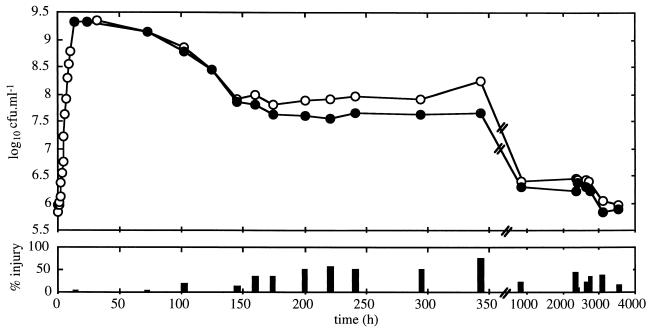
Viable counts on TSYE agar (○) and Palcam agar (●) of L. monocytogenes incubated in TSYE broth at 30°C.
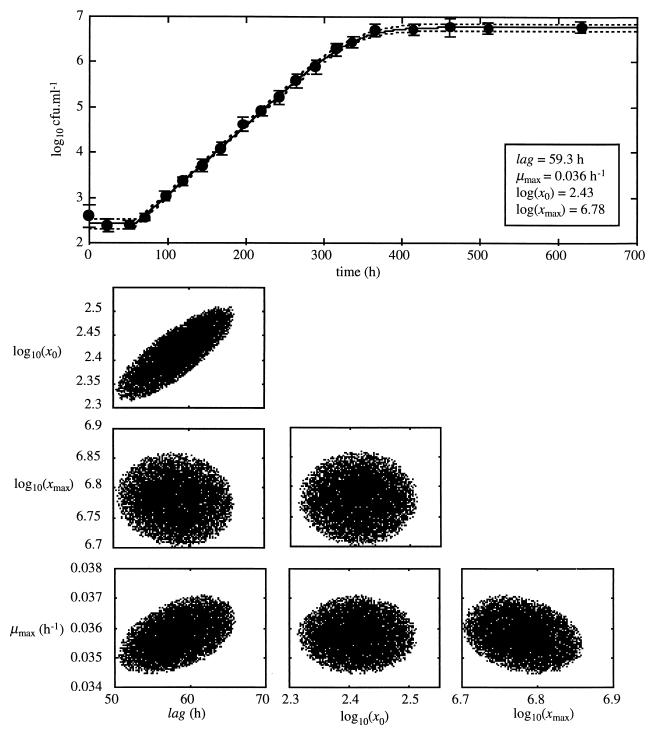
Growth curve of L. monocytogenes grown in TS, pH 6, at 6.5°C after storage at 30°C for 160 h. The solid line is the best fit of the growth model to the data, and the dotted lines define the 95% confidence region for the growth curve. Vertical bars indicate 1 SD of the bacterial cell count. At the bottom are the 95% confidence regions of estimated growth parameters.
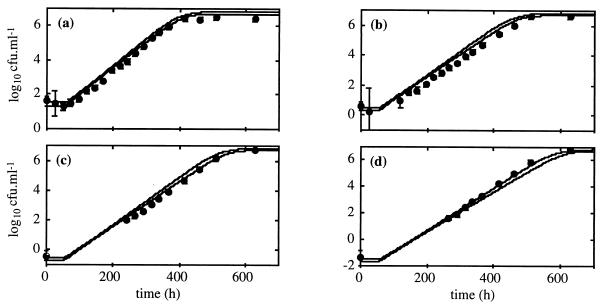
Predicted growth curves and observed bacterial cell counts of L. monocytogenes in TS, pH 6, at 6.5°C after storage for 160 h at 30°C for suspensions with initial bacterial concentrations of 101 (a), 100 (b), 10−1 (c), and 10−2 (d) CFU · ml−1. The solid lines define the 95% confidence regions of the predicted growth curves from the parameters estimated with the initial bacterial concentration of 102 CFU · ml−1. Vertical bars indicate 1 SD.
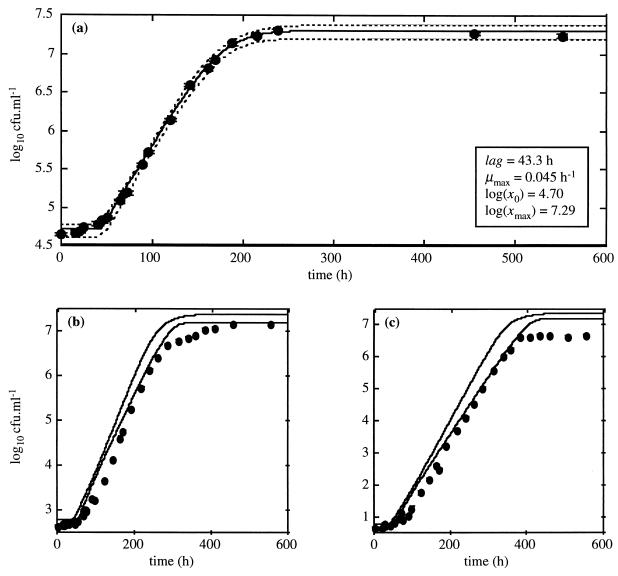
Growth curve of L. monocytogenes in TS, pH 6, at 6.5°C after storage for 840 h at 30°C for the suspension with initial bacterial count of 104 CFU · ml−1 (a) and predicted growth curves and observed bacterial cell counts for suspensions with initial bacterial concentrations of 102 (b) and 100 (c) CFU · ml−1. In panel a, the solid line is the best fit of the growth model to the data and the dotted lines define the 95% confidence region for the growth curve. In panels b and c, the solid lines define the 95% confidence regions of the predicted growth curves. Vertical bars indicate 1 SD of the bacterial cell count.
References
-
- Albertson N H, Nyström T, Kjelleberg S. Macromolecular synthesis during recovery of the marine Vibrio sp. S14 from starvation. J Gen Microbiol. 1990;136:2201–2207.
-
- Baranyi J. Comparison of stochastic and deterministic concepts of bacterial lag. J Theor Biol. 1998;192:403–408. - PubMed
-
- Baranyi J, Roberts T A, McClure P. A non-autonomous differential equation to model bacterial growth. Food Microbiol. 1993;10:43–59.
-
- Bates D M, Watts D G. Nonlinear regression analysis and its applications. New York, N.Y: Wiley; 1988. pp. 200–231.
-
- Box G E P, Hunter W G, Hunter J S. Statistics for experimenters: an introduction to design, data analysis and model building. New York, N.Y: Wiley; 1978. pp. 505–509.
Publication types
MeSH terms
Substances
LinkOut - more resources
Full Text Sources
Other Literature Sources
