. 2000 Apr 3;149(1):33-40.
doi: 10.1083/jcb.149.1.33.

Fusion of constitutive membrane traffic with the cell surface observed by evanescent wave microscopy

Affiliations

Fusion of constitutive membrane traffic with the cell surface observed by evanescent wave microscopy

D Toomre et al. J Cell Biol. .

Abstract

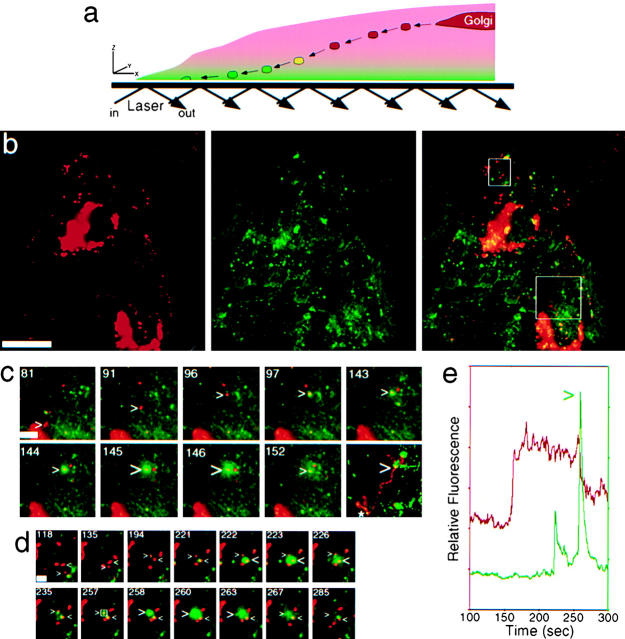
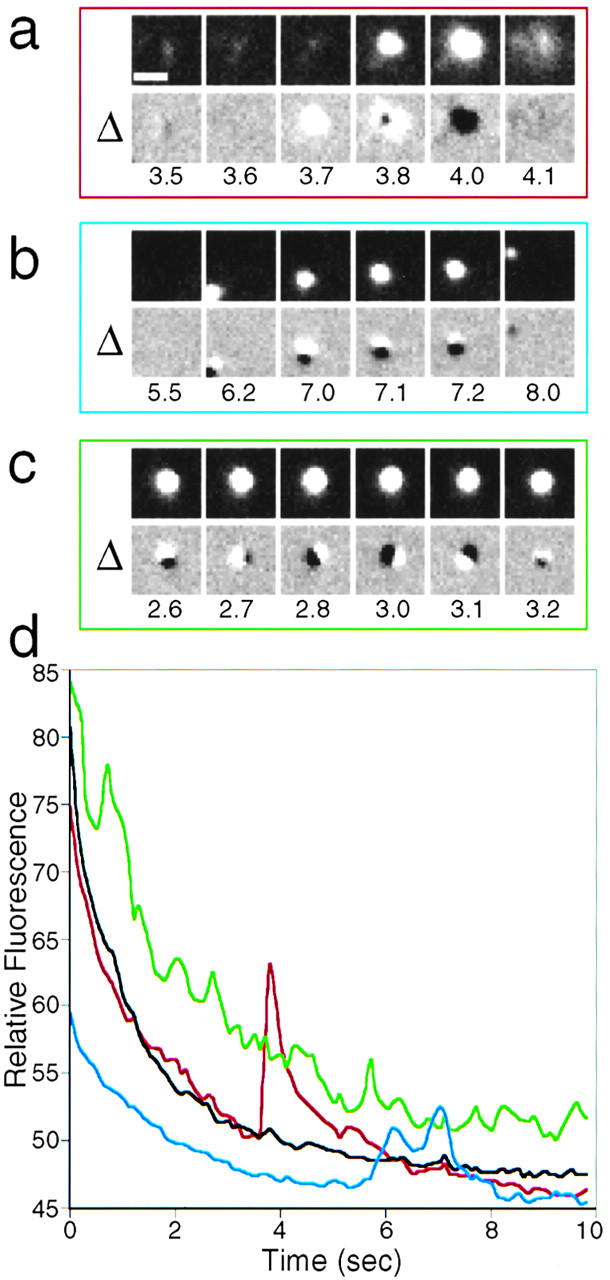
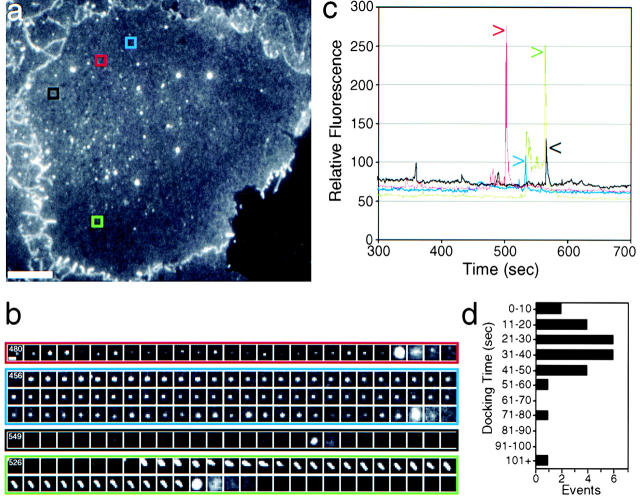
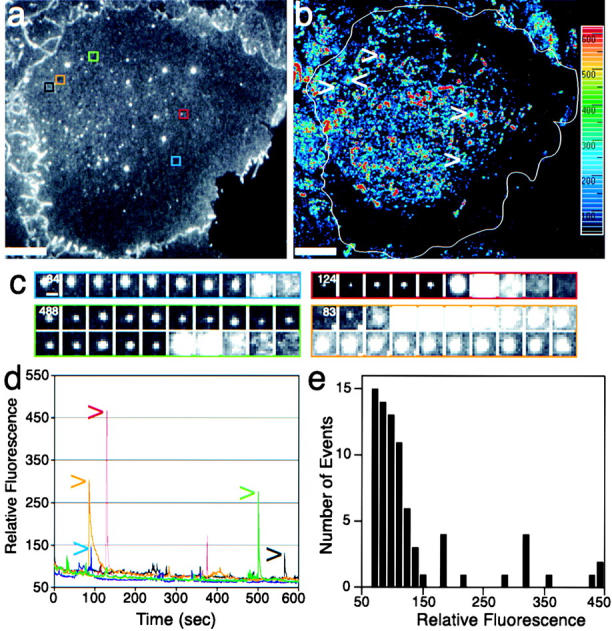
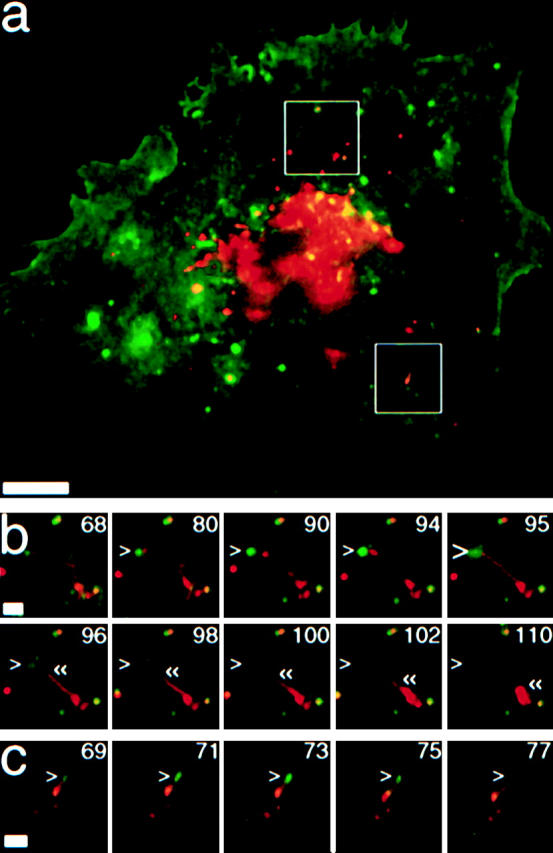
Monitoring the fusion of constitutive traffic with the plasma membrane has remained largely elusive. Ideally, fusion would be monitored with high spatial and temporal resolution. Recently, total internal reflection (TIR) microscopy was used to study regulated exocytosis of fluorescently labeled chromaffin granules. In this technique, only the bottom cellular surface is illuminated by an exponentially decaying evanescent wave of light. We have used a prism type TIR setup with a penetration depth of approximately 50 nm to monitor constitutive fusion of vesicular stomatitis virus glycoprotein tagged with the yellow fluorescent protein. Fusion of single transport containers (TCs) was clearly observed and gave a distinct analytical signature. TCs approached the membrane, appeared to dock, and later rapidly fuse, releasing a bright fluorescent cloud into the membrane. Observation and analysis provided insight about their dynamics, kinetics, and position before and during fusion. Combining TIR and wide-field microscopy allowed us to follow constitutive cargo from the Golgi complex to the cell surface. Our observations include the following: (1) local restrained movement of TCs near the membrane before fusion; (2) apparent anchoring near the cell surface; (3) heterogeneously sized TCs fused either completely; or (4) occasionally larger tubular-vesicular TCs partially fused at their tips.


Figures

Figure 1
Figure 1
Live cell visualization of the late exocytic pathway by combined EPI and TIR. (a) Principle of a combined epifluorescence/evanescent wave microscope. See also accompanying QuickTime movies available at http://www.jcb.org/cgi/content/full/149/1/33/DC1. Organelles and TCs away from the plasma membrane (>100 nm) are visible by EPI (red) only. Once TCs approach the plasma membrane, they also become visible by TIR (green). In an overlay of the two channels, originally red, TCs turn yellow and subsequently green as they approach the plasma membrane and later fuse. (b) Two live cells imaged by EPI and TIR. Individual channels and a merge are shown. Boxes indicate areas enlarged in c and d. (c) A TC exits the Golgi complex and moves to the plasma membrane (small >), where it docks and partially fuses (large >). A running subtraction of successive frames tracks the movement of the TC from the Golgi complex to the apparent docking site (last frame). (d) Two TCs that undergo successive fusion in close proximity. Only the second (>) undergoes complete fusion. The time is indicated in seconds. (e) Plot of the relative fluorescence intensity of the second fusion event boxed in d. Note that the decrease in EPI fluorescence (red) is accompanied by a large, sharp increase in TIR fluorescence (green) when fusion occurs (>). The small TIR peak is due to an earlier (222 s) nearby fusion event. Bars: (b) 20 μm; (c) 4 μm; (d) 2 μm.
Figure 2
Figure 2
Fusion at the plasma membrane gives a unique signature. See also accompanying QuickTime movie available at http://www.jcb.org/cgi/content/full/149/1/33/DC1. In any given field (a–c, top) TCs were observed to either fuse (a), move across (b), or hover (tethered, but with motion in the z-axis) above the plasma membrane without undergoing fusion (c). A differential analysis (Δ, see Materials and Methods) allows one to distinguish these possibilities. A true fusion event results in sequential white and black clouds which expand as donutlike rings (a). TCs moving across the field result in black and white dots that keep their respective orientation (b). A TC hovering above the plasma membrane yields an asymmetric pattern in which the relative orientation of the dots changes over time (c). (d) Relative fluorescence intensity measured by TIR in fields (a–c) over time. Note that only a true fusion event (red trace) leads to a sharp increase in the fluorescence signal, generating an asymmetric peak with a long trailing edge as the protein diffuses into the membrane. The black curve shows the fluorescence intensity in an adjacent area without TCs; the initial decrease in fluorescence intensity is due to photobleaching at the plasma membrane which also facilitates detection of newly fusing TCs. Bar: 1 μm. Time is indicated in seconds.
Figure 3
Figure 3
Surface tethering often precedes membrane fusion. See also accompanying QuickTime movies available at http://www.jcb.org/cgi/content/full/149/1/33/DC1. (a) Cell surface visualized by TIR. (b) Sequential frames (1-s intervals) of the areas boxed in a show differential behavior of TCs. Many oscillate along the z-axis and then rapidly fuse (red), or stay tethered at the same position for up to a minute before fusion (blue). The intensity of the TIR signal changes over time but hardly moves within the xy-plane, suggesting the TC is tethered. Occasionally, TCs approach rapidly and only become visible at fusion (black). A trace of a tubular TC that slowly approaches the surface at an angle, and then slowly fuses is shown (green). The time of the first frame of the sequences is indicated in seconds. (c) The relative fluorescence intensity of the respective boxed regions is shown over time. Fusion events are indicated by arrows. (d) Histogram of the docking time (movement <2 μm) before fusion. Bars: (a) 10 μm; (b) 1 μm.
Figure 4
Figure 4
TCs fusing at the plasma membrane are heterogeneous in size and kinetics. See also accompanying Quick-Time movies available at http://www.jcb.org/cgi/content/full/149/1/33/DC1. (a) Cell surface visualized by TIR. (b) A time projection of difference images (see Materials and Methods) highlights TC fusion and movement. While there is substantial activity in the central region (red to light blue), only a few fusion events occur in the cell periphery (purple to black). Strong fusion events are seen as a red dot surrounded by a blue halo. Sequential frames (c) and the fluorescence intensity plot (d) of the areas marked in a and b show fusion events of different magnitude. Frames of the black square are shown in Fig. 3. Time of the first frame in the sequence is indicated in seconds. (e) Histogram of the relative intensity for all fusion events observed in this cell. Bars: (a and b) 10 μm; (c) 1 μm.
Figure 5
Figure 5
Large tubular-vesicular TCs can undergo partial fusion at the tip. See also accompanying QuickTime movies available at http://www.jcb.org/cgi/content/full/149/1/33/DC1. (a) Merge of a cell imaged by EPI (red) and TIR (green). Boxes indicate areas enlarged in (b) and (c). (b) A TC approaches the plasma membrane by a tubular extension, tethers with the tip of the tubule (small >), and fuses (large >) at that site. Fusion is transient and incomplete. The tubular extension detaches and collapses back into a globular structure («). (c) Another tubular-vesicular TC approaches the plasma membrane (small >), but retracts without undergoing fusion. Time is indicated in seconds. Bars: (a) 10 μm; (b and c) 2 μm.

References

    1. Axelrod D. Cell–substrate contacts illuminated by total internal reflection fluorescence. J. Cell Biol. 1981;89:141–145. - PMC - PubMed
    1. Axelrod D., Hellen E.H., Fulbright R.M. Total internal reflection fluorescence. In: Lakovicz J. R., editor. Topics in Fluorescence Spectrometry. Plenum Press; New York: 1992. p. 289.
    1. Betz W.J., Angleson J.K. Cellular secretion. Now you see it, now you don't. Nature. 1997;388:423–424. - PubMed
    1. Henry J.P., Darchen F., Cribier S. Physical techniques for the study of exocytosis in isolated cells. Biochimie. 1998;80:371–377. - PubMed
    1. Hirschberg K., Miller C.M., Ellenberg J., Presley J.F., Siggia E.D., Phair R.D., Lippincott-Schwartz J. Kinetic analysis of secretory protein traffic and characterization of Golgi to plasma membrane transport intermediates in living cells. J. Cell Biol. 1998;143:1485–1503. - PMC - PubMed

Publication types

Substances