

Blood flow and oxygenation in peritendinous tissue and calf muscle during dynamic exercise in humans
- PMID: 10747200
- PMCID: PMC2269862
- DOI: 10.1111/j.1469-7793.2000.t01-2-00305.x
Blood flow and oxygenation in peritendinous tissue and calf muscle during dynamic exercise in humans
Abstract
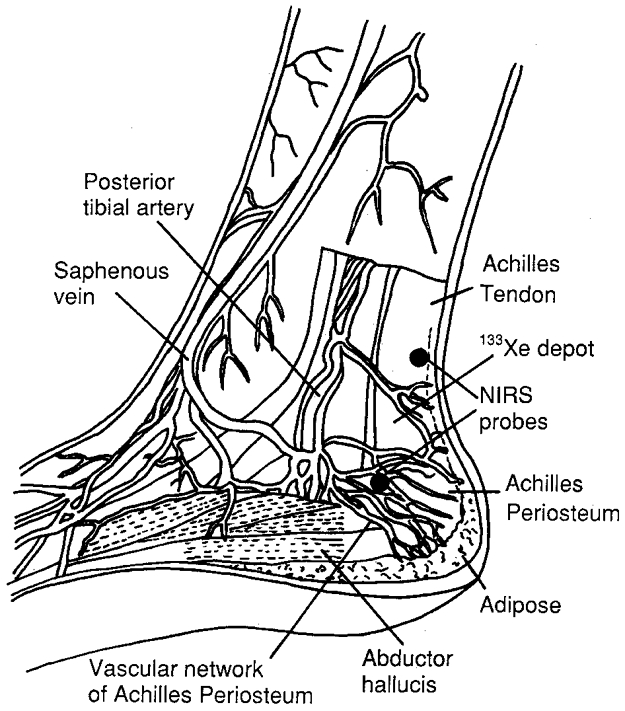
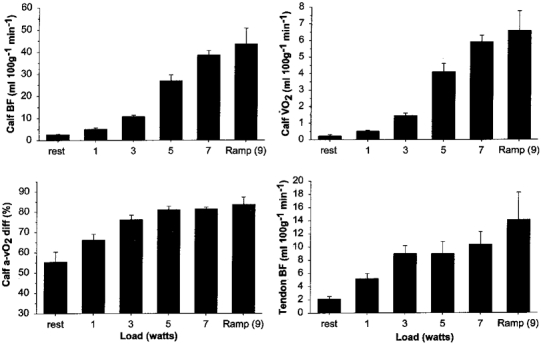
1. Circulation around tendons may act as a shunt for muscle during exercise. The perfusion and oxygenation of Achilles' peritendinous tissue was measured in parallel with that of calf muscle during exercise to determine (1) whether blood flow is restricted in peritendinous tissue during exercise, and (2) whether blood flow is coupled to oxidative metabolism. 2. Seven individuals performed dynamic plantar flexion from 1 to 9 W. Radial artery and popliteal venous blood were sampled for O2, peritendinous blood flow was determined by 133Xe-washout, calf blood flow by plethysmography, cardiac output by dye dilution, arterial pressure by an arterial catheter-transducer, and muscle and peritendinous O2 saturation by spatially resolved spectroscopy (SRS). 3. Calf blood flow rose 20-fold with exercise, reaching 44 +/- 7 ml (100 g)-1 min-1 (mean +/- s.e.m. ) at 9 W, while Achilles' peritendinous flow increased (7-fold) to 14 +/- 4 ml (100 g)-1 min-1, which was 18 % of the maximal flow established during reactive hyperaemia. SRS-O2 saturation fell both in muscle (from 66 +/- 2 % at rest to 57 +/- 3 %, P < 0.05) and in peritendinous regions (58 +/- 4 to 52 +/- 4 %, P < 0.05) during exercise along with a rise in leg vascular conductance and microvascular haemoglobin volume, despite elevated systemic vascular resistance. 4. The parallel rise in calf muscle and peritendinous blood flow and fall in O2 saturation during exercise indicate that blood flow is coupled to oxidative metabolism in both tissue regions. Increased leg vascular conductance accompanied by elevated microvascular haemoglobin volume reflect vasodilatation in both muscle and peritendinous regions. However, peak exercise peritendinous blood flow reaches only approximately 20 % of its maximal blood flow capacity.
Figures


 ), TPR (▪) and non-leg vascular resistance (NLVR,), MAP, and LVC at rest and during plantar flexion exercise. Asterisks for NLVR indicate difference from the resting level (P < 0.05).
 and
and , Achilles' peritendinous region. Values are means and
References
-
- Athanasiu J, Carvallo J. Le travail musculaire et le rhythme due coeur. In: Bouchard Chaveau, Marey, editors. Archives de Physiologie, Normal et Pathologique. Paris: Masson et Cie Editeurs, Libraires de L'Académie de Medicine; 1898. pp. 348–362.
-
- Baez S. Skeletal muscle and gastrointestinal microvascular morphology. In: Kaley G, Altura BM, editors. Microcirculation. Baltimore, MD, USA: University Park Press; 1977. pp. 69–94.
-
- Barlow TE, Haigh AL, Walder DN. Evidence for two vascular pathways in skeletal muscle. Clinical Science. 1961;20:367–385. - PubMed
-
- Boushel R, Pott F, Madsen P, Rådegran G, Nowak M, Quistorff B, Secher NH. Muscle metabolism from near infrared spectroscopy during rhythmic handgrip in humans. European Journal of Applied Physiology. 1998;79:41–48. - PubMed
-
- Bülow J, Tøndevold E. Blood flow in different adipose tissue depots during prolonged exercise in dogs. Pflügers Archiv. 1982;392:235–238. - PubMed
Publication types
MeSH terms
Substances
LinkOut - more resources
Full Text Sources
Medical
Miscellaneous