. 2000 Apr 15;20(8):3017-32.
doi: 10.1523/JNEUROSCI.20-08-03017.2000.

Contrast gain control in the visual cortex: monocular versus binocular mechanisms

Affiliations

Contrast gain control in the visual cortex: monocular versus binocular mechanisms

A M Truchard et al. J Neurosci. .

Abstract

In this study, we compare binocular and monocular mechanisms underlying contrast encoding by binocular simple cells in primary visual cortex. At mid to high levels of stimulus contrast, contrast gain of cortical neurons typically decreases as stimulus contrast is increased (). We have devised a technique by which it is possible to determine the relative contributions of monocular and binocular processes to such reductions in contrast gain. First, we model the simple cell as an adjustable linear mechanism with a static output nonlinearity. For binocular cells, the linear mechanism is sensitive to inputs from both eyes. To constrain the parameters of the model, we record from binocular simple cells in striate cortex. To activate each cell, drifting sinusoidal gratings are presented dichoptically at various relative interocular phases. Stimulus contrast for one eye is varied over a large range whereas that for the other eye is fixed. We then determine the best-fitting parameters of the model for each cell for all of the interocular contrast ratios. This allows us to determine the effect of contrast on the contrast gain of the system. Finally, we decompose the contrast gain into monocular and binocular components. Using the data to constrain the model for a fixed contrast in one eye and increased contrasts in the other eye, we find steep reductions in monocular gain, whereas binocular gain exhibits modest and variable changes. These findings demonstrate that contrast gain reductions occur primarily at a monocular site, before convergence of information from the two eyes.


Figures

Fig. 1.
Fig. 1.
A, Experimental design. In each trial, drifting sinusoidal gratings are presented simultaneously to the two eyes for 4 sec. The stimulus contrast and spatiotemporal phase are systematically varied from trial to trial in the varied eye, whereas the grating configuration in the fixed eye does not change.B, Model of contrast gain control for binocular simple cells. The input to each eye is a drifting sinusoidal grating, with specified contrast (CV orCF) and phase (θV or θF). The monocular filter transforms the signal: the amplitude is multiplied by the monocular gain (GV orGF), and the monocular phase lag (ϕV or ϕF) is added to the signal phase. Signals from the two eyes are summed linearly and passed through a binocular filter, with specified binocular gain (GB) and binocular phase lag (ϕB). Finally, the signal is transformed by a static output nonlinearity. Some parameters in the model are contrast-dependent; these are marked by filled arrows. These parameters are allowed to vary freely as a function of contrast (CV) in the varied eye. The model thus permits a distinction between contrast-dependent effects at a monocular site (GV, ϕV) or a binocular site (GB, ϕB). Potential effects of contrast at other sites (GF, ϕF, and the output nonlinearity) are considered in Results.
Fig. 2.
Fig. 2.
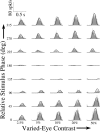
PSTHs for an experiment involving a binocular simple cell. Each PSTH represents the averaged response of the neuron to a full cycle of stimulation, for a given stimulus configuration. In one eye, contrast is fixed at 50%. In the other, contrast is varied from 5 to 50% (columns) and stimulus phase is varied over a 360° range (rows). These manipulations result in systematic changes in response amplitude and phase. TheF1 component of each PSTH was determined, and these values were used to extract model parameters. The fits of the model to the data are shown (solid-line curves). The PSTH in thetop left-hand corner indicates the scale for this figure and displays the average response of the neuron when no stimulus was present.
Fig. 3.
Fig. 3.
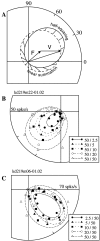
A, This polar plot illustrates the amplitude and phase of the F1 response of a hypothetical neuron stimulated dichoptically by drifting sinusoidal gratings. If the neuron is strictly linear, then the neural response equals the vectorial sum of a varied-eye (V) and a fixed-eye (F) response component. As the phase of the stimulus of the varied eye is varied over a 360° range, the phase of V varies by equal amounts. This causes the net neural response to follow a circular trajectory (dashed line). Fourier analysis of this trajectory provides a direct estimate of the magnitude and phase of V and F. If this analysis is repeated for multiple levels of contrast in the varied eye, then one can determine the relative contributions of monocular gain control (which affects only V) and of binocular gain control (which affects both V andF). This analysis must incorporate the output nonlinearity, which distorts and generally elongates the response trajectory (solid line). B,C, These polar plots show the F1 responses of two simple cells to dichoptically presented sinusoidal gratings. The polar plot in B corresponds to the PSTH data of Figure 2. In B and C, contrast was varied from 2.5 to 50% in one eye but was fixed at 50% in the other eye. Each contrast level is represented by a unique symbol and a unique line style, and the corresponding left-eye and right-eye contrast values are shown in the legend. At each contrast level, the relative phase of the left-eye and right-eye gratings was also varied, so that eight data points were collected for each of five contrast levels. Symbols denote individual data points, whereas lines represent the model fit to the data. The approximate radius of each curve represents the contribution made by the varied eye to the response of the cell. For each cell, the radius grows as a function of varied-eye contrast, but the rate of growth is small when compared with the 20-fold change in contrast. This indicates that the increase in varied-eye contrast reduces the response gain of the monocular and/or binocular pathways.
Fig. 4.
Fig. 4.
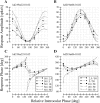
Amplitude (A, B) and phase (C, D) of responses of binocular simple cells to drifting gratings. Data in A andC are replotted from Figure 3B, whereas data in B and D are replotted from Figure3C. Because stimulus phase in the fixed eye is constant, the relative interocular phase is determined by the stimulus phase in the varied eye. At each contrast level in the varied eye, changes in the relative interocular phase produce systematic changes in response amplitude (Fig.5A,B) and response phase (Fig. 5C,D). Consistent with linear binocular interactions in the simple cell, the relative-phase tuning functions in Figure 5, A and B, are unimodal, with a peak and a trough reflecting the periodic summation and cancellation of the inputs from the two eyes (Ohzawa and Freeman, 1986). The fits of the model to the data are shown by thesolid-line curves. The apparent 360° discontinuities in the phase-versus-phase plots (C, D) reflect the fact that response phase is a cyclic quantity.
Fig. 5.
Fig. 5.
The effect of varied-eye contrast on monocular and binocular gain parameters for the two cells of Figures 3 and 4. All parameters values are normalized to the corresponding value in the 50% contrast condition. Data from the cell of Figure 3B are shown in A and C, whereas data from the cell of Figure 3C are shown in B andD. Error bars denote the parameters' formal SE values, as determined by the Levenberg-Marquardt procedure, and inB and D, solid lineswithout error bars denote the results obtained from a repetition of the experimental procedure for this cell. As contrast in the varied eye increases, the monocular gain drops dramatically for both neurons, whereas the binocular gain shows either no change (C) or a modest reduction (D). For comparison, note that if a monocular gain control system were 100% effective at counteracting the effects of increased contrast in one eye, then a slope of −1 would be obtained on these log–log axes (A, B,dashed lines). The filled circles in the margins of C and D indicate the relative binocular gain in the absence of stimulation in the varied eye (0% contrast).
Fig. 6.
Fig. 6.
Gain parameters as a function of varied-eye contrast for experiments with a high (∼50%) contrast in the fixed eye. Each line in A, C,E, and G represents the outcome from a single experiment. All parameter values are normalized relative to the corresponding parameter value at 50% contrast. (In some cases, this normalization required a slight interpolation or extrapolation to the 50% value, attributable to contrast correction.) Point-by-point averages of these curves are shown in B,D, F, and H, respectively, with ±1 SD error bars at five arbitrarily chosen contrast levels. Note that there is a difference in scale between the phase data from individual experiments (E, G) and the averaged phase data (F,H). A, B, For all experiments, the monocular gain parameter is sharply reduced by stimulus contrast: the monocular gain slope, or slope of the contrast-versus-gain curve, is nearly −1 (dotted line) in every case. C, D, Most cells show contrast-dependent reductions in binocular gain, but these effects are modest in comparison to the monocular gain effects. The filled circles in the margins indicate the relative binocular gain parameter with 0% contrast in the varied eye. E,F, The effect of increased contrast on monocular phase lag is somewhat variable, at least in part because estimates of this parameter were noisy. On average, no net change in this parameter is seen as contrast is raised from 5 to 50% in the varied eye. G, H, An increase in contrast from 5 to 50% has at best a modest effect on the binocular phase lag. On average, a contrast-induced binocular phase lag is observed when the 0 and 50% contrast conditions are compared, although this effect is highly variable.
Fig. 7.
Fig. 7.
Analysis of a binocular simple cell stimulated with relatively low contrast (10%) in the fixed eye. Data are presented in the format of Figures 3 and 5. A, Polar plot representation of the responses. B, A noisy signal at low contrasts may be responsible for this sharp effect of varied-eye contrast on the estimated monocular phase parameter. C,D, As for the experiments with 50% contrast in the fixed eye, an increase of contrast in one eye sharply reduces the monocular gain but has little or no effect on the binocular gain.
Fig. 8.
Fig. 8.
Results from experiments with low contrast (4–10%) in the fixed eye are shown here, following the format of Figure 6. As in the case of the fixed high-contrast experiments, an increase in varied-eye contrast has weak and inconsistent effects on the binocular gain (C, D) but sharply reduces the monocular gain (A, B). Phase data are not shown because of the difficulty of obtaining reliable phase estimates under low-contrast conditions.
Fig. 9.
Fig. 9.
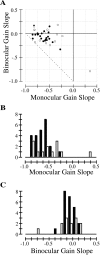
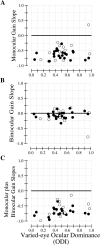
Monocular and binocular gain slopes are shown for experiments with a high contrast (50%; filled symbols) or a lower contrast (4–10%; unfilled symbols) in the fixed eye. These slopes are calculated from the logarithmic plots of contrast versus gain. A, Monocular gain slopes are plotted against binocular gain slopes. When the sum of the monocular and binocular gain slope equals −1, 100% gain control has been achieved; this is denoted by the dotted line.B, Apart from an extreme outlier, the monocular gain slopes are consistently negative, with a mean value of −0.48 (SD = 0.32) and −0.64 (SD = 0.15) for the low- and high-contrast experiments, respectively. Thus, contrast-dependent gain reductions at a monocular site play a major role in determining the responses of binocular simple cells. These monocular gain slopes values can be compared to a value of −1, which corresponds to 100% effective gain control. C, Binocular gain slopes cluster near 0, indicating a less important role for binocular gain reductions.
Fig. 10.
Fig. 10.
Analysis of the relationship between the ocular dominance index (ODI) of a neuron and the magnitude of contrast-dependent gain reductions. Data are shown for experiments with a high contrast (50%, solid circles) or a lower contrast (4–10%, unfilled circles) in the fixed eye. The horizontal line at 0 corresponds to the absence of gain control, whereas gain values of −1 correspond to 100% gain control. Correlations between ODI and monocular gain slope or binocular gain slope are not significant (p > 0.05), regardless of whether the high- and low-contrast conditions are considered separately or together.
Fig. 11.
Fig. 11.
Variations on the gain control model. Each plot shows the fit (solid-line curves) of various models to data (symbols) collected from a binocular simple cell; the data are identical in the various plots. A, Cubic splines provide a convenient way of looking at the raw data. The percentage residual error is by definition 0. B, In the standard model (2.0% residual error), the phase and gain parameters for both eyes are allowed to change with contrast; the exponent and offset are fixed at 2 and 0, respectively. C, In the exponent model (1.8% residual error), both the monocular gain and the output exponent are allowed to vary with contrast; thus, any binocular gain control effects must be mediated by a change in exponent.D, In the offset model (1.9% residual error), the exponent is fixed at 2, and the additive offset parameter serves as the potential site of gain control. E, F, In these models, gain control is required to operate exclusively at a monocular or binocular site; the percentage residual error is 2.1 and 6.3%, respectively. Note that most of the models (modelsBE) allow gain control to operate at a monocular site; the output from these models is qualitatively similar and produces a reasonable fit to the data. The one model without monocular gain control (model F) produces a comparatively poor fit.
Fig. 12.
Fig. 12.
Model fits for a second simple cell, plotted in the same format as Figure 11. The best performing models are those that allow the monocular gain parameter to change as a function of contrast (BE; percentage residual error = 1.6, 1.3, 1.3, and 2.0, respectively). Compared with the output of the standard model (B), in which the output exponent is fixed at a value of 2, the elliptical response profiles produced by the exponent model (C) are narrow and elongated; this is attributable to the higher values of exponent parameter (2.6–3.0), which give the best fit for this cell. Overall, however, the performance of models BE is similar. On the other hand, the binocular gain control model performs poorly (F; percentage residual error = 7.92%). The worst fits are evident at the extremes of the contrast range tested: at 2.5% contrast, the response curve is too small (solid-line curve), whereas at 50% contrast the response curve is too large (exterior dashed-line curve). This pattern of error is expected if gain control is mediated at a monocular site.

Similar articles

Cited by

References

    1. Albrecht DG, Geisler WS. Motion sensitivity and the contrast-response function of simple cells in visual cortex. Vis Neurosci. 1991;7:531–546. - PubMed
    1. Albrecht DG, Hamilton DB. Striate cortex of monkey and cat: contrast response function. J Neurophysiol. 1982;48:217–237. - PubMed
    1. Albrecht DG, Farrar SB, Hamilton DB. Spatial contrast adaptation characteristics of neurones recorded in the cat's visual cortex. J Physiol (Lond) 1984;347:713–739. - PMC - PubMed
    1. Anderson PA, Movshon JA. Binocular combination of contrast signals. Vision Res. 1989;29:1115–1132. - PubMed
    1. Anzai A, Bearse MA, Jr, Freeman RD, Cai D. Contrast coding by cells in the cat's striate cortex: monocular vs. binocular detection. Vis Neurosci. 1995;12:77–93. - PubMed

Publication types

LinkOut - more resources