. 2000 Mar 1;28(5):754-66.
doi: 10.1016/s0891-5849(00)00161-1.

Mitochondrial oxidative stress in mice lacking the glutathione peroxidase-1 gene

Affiliations

Mitochondrial oxidative stress in mice lacking the glutathione peroxidase-1 gene

L A Esposito et al. Free Radic Biol Med. .

Abstract

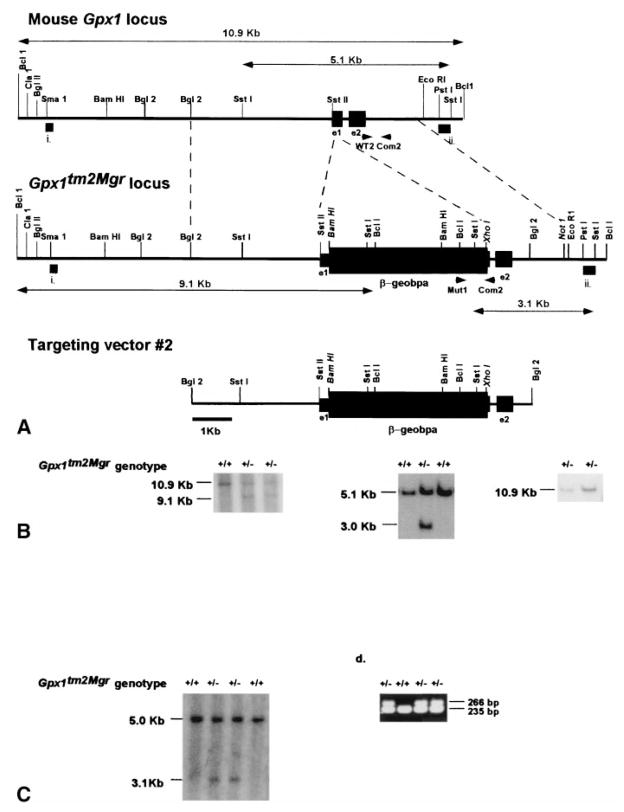
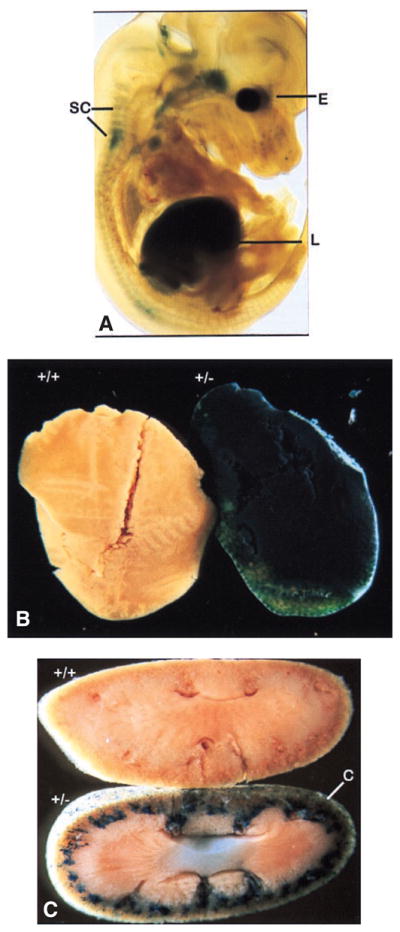
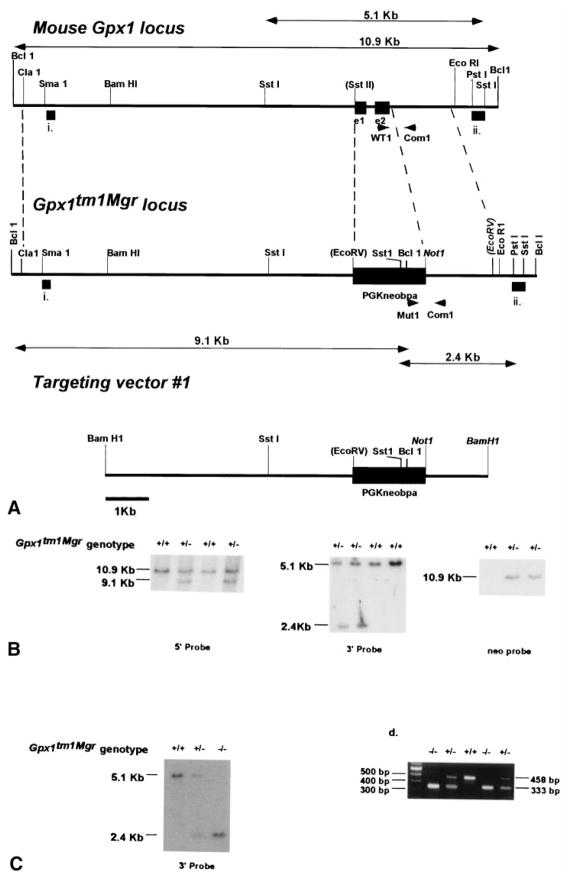
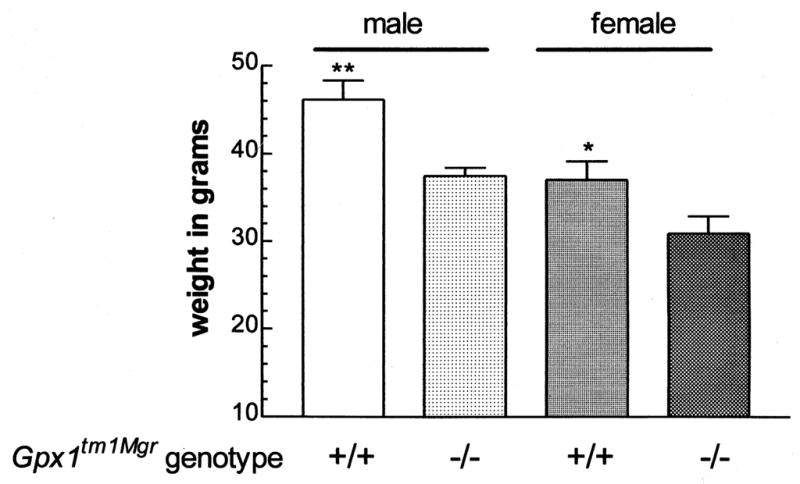
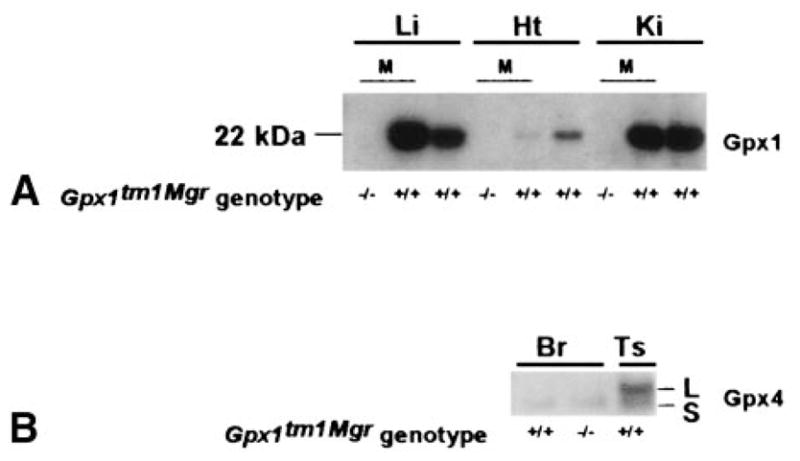
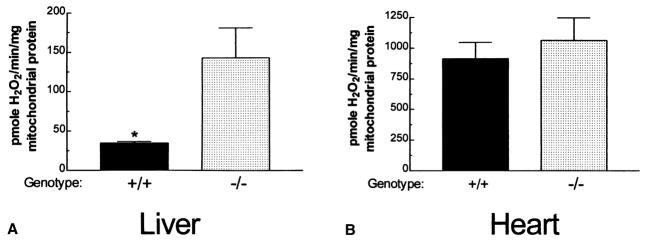
Oxidative stress resulting from mitochondrially derived reactive oxygen species (ROS) has been hypothesized to damage mitochondrial oxidative phosphorylation (OXPHOS) and to be a factor in aging and degenerative disease. If this hypothesis is correct, then genetically inactivating potential mitochondrial antioxidant enzymes such as glutathione peroxidase-1 (Gpx1; EC 1.11.1.9) should increase mitochondrial ROS production and decrease OXPHOS function. To determine the expression pattern of Gpx1, isoform-specific antibodies were generated and mutant mice were prepared in which the Gpx1 protein was substituted for by beta-galactosidase, driven by the Gpx1 promoter. These experiments revealed that Gpx1 is highly expressed in both the mitochondria and the cytosol of the liver and kidney, but poorly expressed in heart and muscle. To determine the physiological importance of Gpx1, mice lacking Gpx1 were generated by targeted mutagenesis in mouse ES cells. Homozygous mutant Gpx1(tm1Mgr) mice have 20% less body weight than normal animals and increased levels of lipid peroxides in the liver. Moreover, the liver mitochondria were found to release markedly increased hydrogen peroxide, a Gpx1 substrate, and have decreased mitochondrial respiratory control ratio and power output index. Hence, genetic inactivation of Gpx1 resulted in growth retardation, presumably due in part to reduced mitochondrial energy production as a product of increased oxidative stress.


Figures

Fig. 1
Fig. 1
Generation of Gpx1tm2Mgr (−/−) mice. (A) Diagram of the desired homologous recombination event occurring in ES cells to create the Gpx1tm2Mgr mutant allele. The top line represents a partial restriction map of the wild type Gpx1 locus with exons 1 and 2 (smaller black rectangles) indicated. The Gpx1tm2Mgrtargeting vector is shown on the bottom, with the fusion between exon 1 of Gpx1 (smaller black rectangle) and the β-geobpA cassette (larger black rectangle) shown. Selection for proper homologous recombination of the targeted construct in ES cells, shown in the middle, requires expression of the fusion gene product driven by the endogenous Gpx1 promoter. The thick bars indicated as (i) and (ii) indicate the 5′ and 3′ probes used in the Southern analysis shown in (B). The internal neo probe is not shown. The small arrow heads indicate the PCR primers used in (D) to detect the wild type and mutant alleles. The double arrow lines above and below the wild type and mutant alleles, respectively, indicate the BclI (10.9 and 9.1 kb) and SstI (5.1 kb and 3.1 kb) fragments detected by the probes. Restriction enzymes in italics indicate artificial sites created by PCR cloning of the desired genomic fragment for constructing the targeting vector. (B) Southern analysis of neomycin-resistant ES cell clones. Southern blots contain BclI-digested (left and right) and SstI-digested (middle) genomic DNA, probed with 5′ (left) and 3′ (middle) probes (external to the homologous arms of the targeting vector), as well as an internal neo probe (right) to detect possible tandem insertions. The deduced genotype of each clone is shown above the lanes. (C) Southern analysis of intercross progeny for the presence of the Gpx1tm2Mgr mutant allele. SstI-digested genomic DNA was probed with the 3′ probe as in (A). (D) Multiplex PCR screen of intercross progeny for the presence of the Gpx1tm2Mgr mutant allele. The position of the PCR primers are indicated in (A).
Fig. 2
Fig. 2
Expression analysis of Gpx1 using X-Gal-stained mouse tissues. (A) X-Gal stained heterozygous Gpx1tm2Mgr embryo at e13.5. E = eye, SC = spinal column, L = Liver. (B) X-Gal stained wild type (+/+, left) and heterozygous Gpx1tm2Mgr (+/−; right) adult liver. (C) X-Gal stained wild type (+/+, top) and heterozygous Gpx1tm2Mgr (+/−; bottom) kidney. C = cortex layer.
Fig. 3
Fig. 3
Generation of Gpx1tm1Mgr mice. (A) Diagram of the desired homologous recombination event occurring in ES cells to create the Gpx1tm1Mgr mutant allele. The top line indicates a partial restriction map of the wild type Gpx1 locus as in Fig. 1A. The bottom line shows the Gpx1tm1Mgr targeting vector, containing the PGKneo cassette (larger black rectangle). The final targeted allele, with exons 1 and 2 of Gpx1 replaced by the PGKneo cassette, is shown in the middle, with the regions of homology indicated. Probes for Southern analysis and PCR primers are indicated as in Fig. 1A. The double arrow lines above and below the wild type and mutant alleles respectively indicate the BclI (10.9 kb and 9.1 kb) and SstI (5.1 and 2.4 kb) fragments detected by the probes. Restriction enzymes in parentheses indicate restriction sites destroyed in constructing the targeting vector and restriction enzymes in italics indicate artificial sites created by PCR cloning of the desired genomic fragment for constructing and linearizing the targeting vector. (B) Southern analysis of neomycin-resistant ES cells clones shown as in Fig. 1B. (C) Southern analysis of intercross progeny for the presence of the Gpx1tm1Mgr mutant allele shown as in Fig. 1C. (D) Multiplex PCR screen of intercross progeny for the presence of the Gpx1tm1Mgr mutant allele shown as in Fig. 1D.
Fig. 4
Fig. 4
129B6-Gpx1tm1Mgr mice are smaller than wild type animals by 8 months of age. The bars represent the mean ± SEM for each group. *p < .05; **p < .01 for wild type (+/+) as compared with (−/−) mice of the same sex; n = 15–16 for males, 10–12 for females from each group.
Fig. 5
Fig. 5
Western blot analysis of Gpx1 expression in 129B6-Gpx1tm1Mgr mice. (A) Western analysis of Gpx1 in tissue lysates from wild type (+/+) animals and isolated mitochondria (M) from (+/+) or 129/B6Gpx1tm1Mgr (−/−) animals. Expression was detected with antisera raised against Gpx1, and the 22 kDa monomer is indicated. Li = liver, Ht = heart, Ki = kidney. (B) Western analysis of Gpx4 in tissue lysates from wild type and 129B6-Gpx1tm1Mgr (−/−) animals. Expression was detected with antisera raised against Gpx4. The L indicates the 23 kDa, “long” form including the mitochondrial leader peptide and the S indicates the 20 kDa “short” form, minus the leader peptide [28,29]. Br = brain, Ts = testis.
Fig. 6
Fig. 6
H2O2 release in 129-Gpx1tm1Mgr mouse liver and heart. The bars represent the mean±SEM level of H2O2 release for mitochondria from normal (+/+) and 129-Gpx1tm1Mgr (−/−) liver (A) and heart (B). p < .05 for normal (+/+) as compared with (−/−) mitochondria for the same tissue; n = 4 for each group.

References

    1. Fontaine E, Eriksson O, Ichas F, Bernardi P. Regulation of the pereability transition pore in skeletal muscle mitochondria. Modulation by electron flow through the respiratory chain complex I. J Biol Chem. 1998;273:12662–12668. - PubMed
    1. Chance B, Sies H, Boveris A. Hydroperoxide metabolism in mammalian organs. Physiol Rev. 1979;59:527–605. - PubMed
    1. Beyer W, Imlay J, Fridovich I. Superoxide dismutases. Prog Nucleic Acid Res Mol Biol. 1991;40:221–53. - PubMed
    1. Ursini F, Maiorino M, Brigelius-Flohe R, Aumann KD, Roveri A, Schomburg D, Flohe L. Diversity of glutathione peroxidases. Meth Enzymol. 1995;252:38–53. - PubMed
    1. Melov S, Coskun P, Patel M, Tuinstra R, Cottrell B, Jun AS, Zastawny TH, Dizdaroglu M, Goodman SI, Huang TT, Miziorko H, Epstein CJ, Wallace DC. Mitochondrial disease in superoxide dismutase 2 mutant mice. Proc Natl Acad Sci USA. 1999;96:846–51. - PMC - PubMed

Publication types

MeSH terms