. 2000 Mar 6;191(5):823-34.
doi: 10.1084/jem.191.5.823.

Identical T cell clones are located within the mouse gut epithelium and lamina propia and circulate in the thoracic duct lymph

Affiliations

Identical T cell clones are located within the mouse gut epithelium and lamina propia and circulate in the thoracic duct lymph

T Arstila et al. J Exp Med. .

Abstract

Murine gut intraepithelial (IEL) T cell receptor (TCR)-alpha/beta lymphocytes bearing CD8alpha/13 or CD8alpha/alpha coreceptors have been shown previously to express different oligoclonal TCR beta chain repertoires in the same mouse, in agreement with other evidence indicating that these two populations belong to different ontogenic lineages, with only CD8alpha/beta+ IELs being fully thymus dependent. CD8alpha/beta+, but not CD8alpha/alpha+, T lymphocytes are also present in the lamina propria. Here, we show that CD8alpha/beta+ lymphocytes from the lamina propria and the epithelium are both oligoclonal, and that they share the same TCR-beta clonotypes in the same mouse, as is also the case for CD4alpha T cells. Furthermore, identical T cell clones were detected among CD8alpha/beta IELs and CD8alpha/beta+ blasts circulating into the thoracic duct (TD) lymph of the same mouse, whereas TD small lymphocytes are polyclonal. These findings must be considered in light of previous observations showing that T blasts, but not small T lymphocytes, circulating in the TD lymph have the capacity of homing into the gut epithelium and lamina propria. These combined observations have interesting implications for our understanding of the recirculation of gut thymus-dependent lymphocytes and their precursors, and of the events leading up to the selection of their restricted TCR repertoire.


Figures

Figure 1
Figure 1
CD4+ and CD8α/β1 LPLs and IELs. Cells that were sorted from the same mouse for further analyses are shown. In this mouse, the percentage of CD4+ IELs, which varies somewhat between different animals, is especially high, as is occasionally seen in old mice maintained in standard conditions. This percentage was lower in the second set of experiments, described below.
Figure 2
Figure 2
Comparison of TCR-β diversity between CD4+ IELs and LPLs, showing BV-BC segment analyses. Few peaks are seen in each panel, strongly suggesting that the populations are oligoclonal. BV genes containing rearrangements of the same size are found in both populations. In each profile, a CDR3 length of 10 amino acids is indicated; the peaks are spaced by 3 nucleotides.
Figure 3
Figure 3
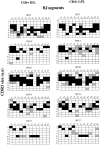
Comparison of TCR-β diversity between CD4+ IELs and LPLs for selected BV genes, showing VB-JB segment analyses. Rearrangements shared between these populations are indicated by black squares, and other rearrangements by gray squares. White squares indicate that no measurable peak corresponding to that BV-BJ combination and CDR3 length was observed. a.a, amino acid(s).
Figure 4
Figure 4
Comparison of TCR-β diversity of CD8α/β1 IELs and LPLs, showing BV-BC segment analyses. Few peaks are seen in each panel, strongly suggesting that the populations are oligoclonal. BV genes containing rearrangements of the same size are found in both populations. In each profile, a CDR3 length of 10 amino acids is indicated; the peaks are spaced by 3 nucleotides.
Figure 5
Figure 5
Comparison of TCR-β diversity between CD8α/β1 IELs and LPLs with selected BV genes, showing VB-JB segment analyses. Rearrangements shared between these populations are indicated by black squares, and other rearrangements by gray squares. White squares indicate that no measurable peak corresponding to that BV-BJ combination and CDR3 length was observed. a.a, amino acid(s).
Figure 6
Figure 6
FACS® analysis of TD lymphocytes used in transfer experiments. TD lymphocytes, strongly enriched for CD8+ lymphocytes (a and b; see Materials and Methods), were tripled stained with anti-CD8β, anti-CD11c, and, after permeabilization, with anti-BrdU. Cells strongly stained with BrdU show high expression of CD11c (d). The CD11c+ population contains larger cells (c) and 20-fold more BrdU+ cells than the CD11c population (not shown). (Note that permeabilization blurs surface fluorescence, but does not change the percentage of fluorescent cells.)
Figure 7
Figure 7
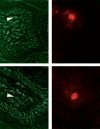
Gut mucosa of a mouse recipient of the BrdU-labeled TD cells shown in Fig. 6. Gut sections displaying two BrdU-labeled cells localized (right) or as seen by phase–contrast microscopy (left) in the epithelium (top) and in the lamina propria (bottom).
Figure 8
Figure 8
Comparison of TCR-β diversity between CD8α/β1 IELs and CD8α/β1CD11c+ TD lymphocytes showing BV-BC segment analyses. Few peaks are seen in each panel, strongly suggesting that the populations are oligoclonal. BV genes containing rearrangements of the same size are found in both populations. TD lymphocytes appear less oligoclonal than IELs; however, the peak size is irregular, contrasting with that displayed by CD8αβ1CD11c TD cells (bottom rows), which show the characteristic regular Gaussian-like profile of a polyclonal population. In each profile, a CDR3 length of 10 amino acids is indicated; the peaks are spaced by 3 nucleotides.
Figure 9
Figure 9
Comparison of TCR-β diversity between CD8α/β1 IELs and CD8α/β1CD11c+ TD lymphocytes with selected BV genes, showing BV-BJ segment analyses. Rearrangements shared between these populations are indicated by black squares, and other rearrangements by gray squares. White squares indicate that no measurable peak corresponding to that BV-BJ combination and CDR3 length was observed. In addition, and for comparison, three examples of the polyclonal repertoire pattern of the CD8α/β1CD11c TD lymphocytes are shown (right). a.a, amino acid(s).
Figure 10
Figure 10
Schema of the lymph to blood circulation of T blasts and dendritic cells antigenically elicited in the gut wall or its associated lymphoid structures (see text for details). Red, T lymphocytes; yellow, dendritic cells; red, postcapillary venules.

References

    1. Rocha B., Guy-Grand D., Vassalli P. Extrathymic T cell differentiation. Curr. Opin. Immunol. 1995;7:235–242. - PubMed
    1. Guy-Grand D., Cuenod-Jabri B., Malassis-Seris M., Selz F., Vassalli P. Complexity of the mouse gut T cell immune systemidentification of two distinct natural killer T cell intraepithelial lineages. Eur. J. Immunol. 1996;26:2246–2258. - PubMed
    1. Guy-Grand D., DiSanto J.P., Henchoz P., Malassis-Seris M., Vassalli P. Small bowel enteropathyrole of intraepithelial lymphocytes and of cytokines (IL12, IFNγ, TNF) in the induction of epithelial cell death and renewal. Eur. J. Immunol. 1998;28:730–744. - PubMed
    1. Regnault A., Cumano A., Vassalli P., Guy-Grand D., Kourilsky P. Oligoclonal repertoire of the CD8α/α and the CD8α/β TCR-α/β murine intestinal intraepithelial T lymphocytesevidence for the random emergence of T cells. J. Exp. Med. 1994;180:1345–1358. - PMC - PubMed
    1. Pannetier C., Cochet M., Darche S., Casrouge A., Zöller M., Kourilsky P. The sizes of the CDR3 hypervariable regions of the murine T cell receptor β chains vary as a function of the recombined germ-line segments. Proc. Natl. Acad. Sci. USA. 1993;90:4319–4323. - PMC - PubMed

Publication types

MeSH terms