. 2000 May;74(9):4377-86.
doi: 10.1128/jvi.74.9.4377-4386.2000.

Cultured cell sublines highly susceptible to prion infection

Affiliations

Cultured cell sublines highly susceptible to prion infection

P J Bosque et al. J Virol. 2000 May.

Abstract

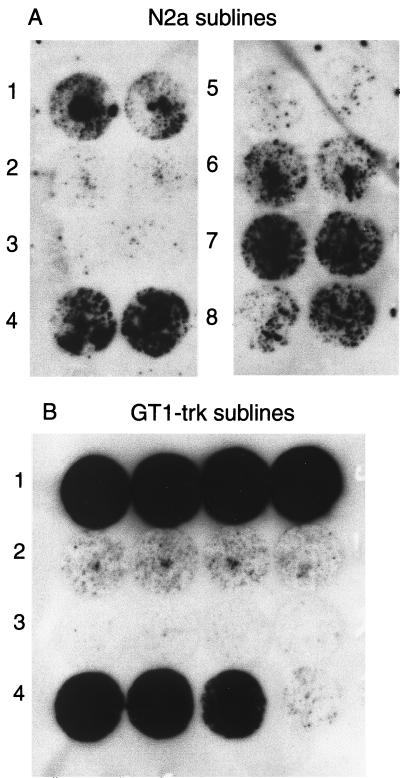
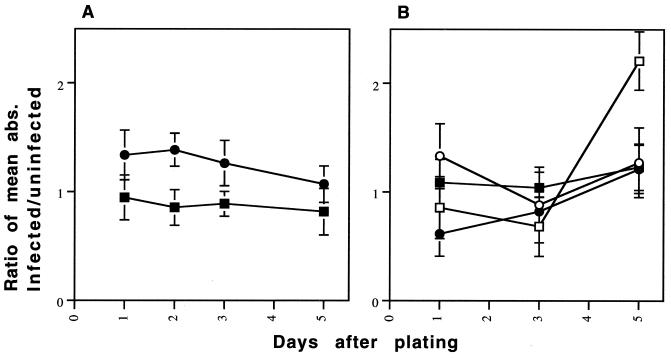
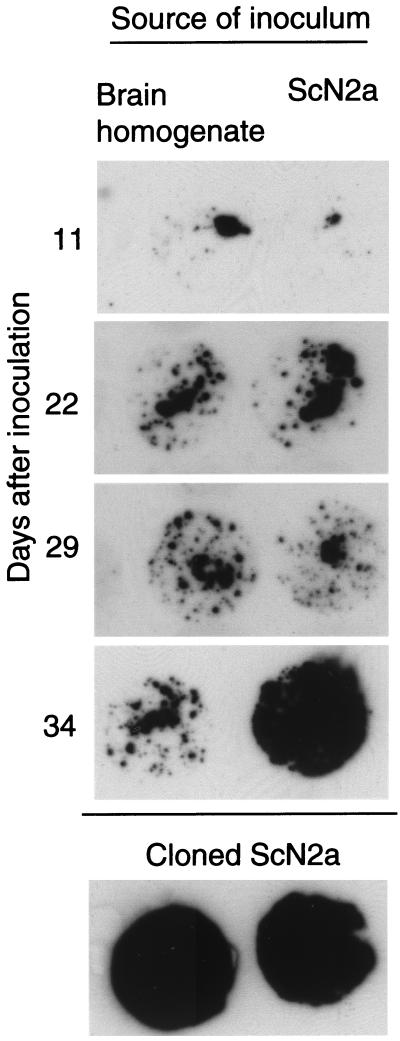
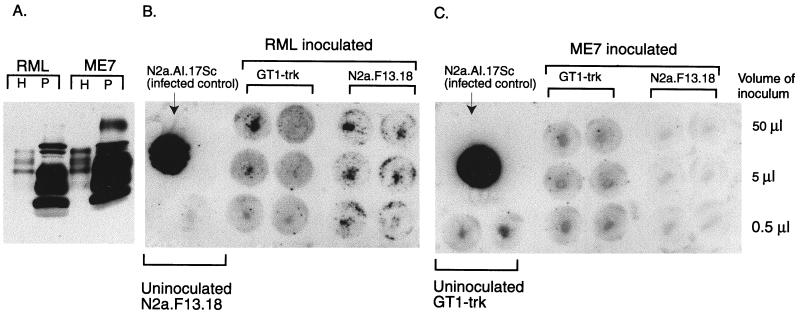
Cultured cell lines infected with prions produce an abnormal isoform of the prion protein (PrP(Sc)). In order to derive cell lines producing sufficient quantities of PrP(Sc) for most studies, it has been necessary to subclone infected cultures and select the subclones producing the largest amounts of PrP(Sc). Since postinfection cloning can introduce differences between infected and uninfected cell lines, we sought an approach to generate prion-infected cell lines that would avoid clonal artifacts. Using an improved cell blot technique, which permits sensitive and rapid comparison of PrP(Sc) levels in multiple independent cell cultures, we discovered marked heterogeneity with regard to prion susceptibility in tumor cell sublines. We exploited this heterogeneity to derive sublines which are highly susceptible to prion infection and used these cells to generate prion-infected lines without further subcloning. These infected sublines can be compared to the cognate uninfected cultures without interference from cloning artifacts. We also used susceptible cell lines and our modified cell blot procedure to develop a sensitive and reproducible quantitative cell culture bioassay for prions. We found that the sublines were at least 100-fold more susceptible to strain RML prions than to strain ME7 prions. Comparisons between scrapie-susceptible and -resistant cell lines may reveal factors that modulate prion propagation.


Figures

FIG. 1
FIG. 1
Sublines vary in susceptibility to scrapie infection. Sublines derived as described in Materials and Methods were inoculated with 30 μl of a homogenate (107 cells/ml) of ScN2a cells. (A) Eight N2a sublines inoculated in duplicate and then passaged for 25 days. Each circular blot in the figure is from a single independently inoculated and passaged population, with pairs of blots from the same subline shown side by side. Sublines 4 and 7 are susceptible, sublines 1, 6, and 8 are of intermediate susceptibility, and sublines 2, 3, and 5 are resistant. (B) GT1-trk sublines inoculated and passaged in quadruplicate for 24 days prior to blotting. Sublines 1 and 4 are susceptible, subline 2 is of intermediate susceptibility, and subline 3 is resistant. Note that the level of PrPSc is consistent in each inoculated culture derived from the same subline. (Cells were confluent on each coverslip prior to blotting except for one coverslip for GT1-trk subline 4, which had a low cell density.)
FIG. 2
FIG. 2
Susceptible subclones produce as much PrPSc after infection as cloned ScN2a does. N2a cells are cells from ATCC stock, not subcloned. ScN2a are scrapie-infected cells derived by subcloning from an inoculated population of N2a. Lines N2a.3Sc and N2a.22Sc were inoculated with prions and then passaged without subcloning for 40 days prior to lysis. Previous cell blots (not shown) demonstrated N2a.3Sc to be prion susceptible, while N2a.22Sc was resistant. (A) Lysates not treated with protease. A total of 75 μg of protein is in each lane. The lower-molecular-weight forms of PrP typically seen in prion-infected N2a lines even without the addition of protease are present in ScN2a and N2a.3Sc lysates. (B) Proteinase K-treated lysates. The product of digestion of 500 μg of total protein is loaded in each lane. ScN2a and N2a.3Sc produce approximately equal amounts of protease-resistant PrP, while no protease-resistant PrP is detectable in N2a.22Sc.
FIG. 3
FIG. 3
Proportion of cells producing PrPSc is similar in inoculated susceptible sublines and ScN2a cells. N2a and GT1 sublines producing large amounts of PrPSc after inoculation with scrapie were further subcloned, and the subsublines were analyzed by cell blotting. (A) Each circular blot represents a separate subsubline derived from N2a.AI.15Sc; 7 of 9 sublines produced readily detectable amounts of proteinase K-resistant PrP. (B) Blots done in duplicate. All four GT1-trk.4Sc sublines were positive. (C) Subclones of clonally established ScN2a lines produced similar results, with 18 of 23 subclones producing detectable proteinase K-resistant PrP (each blot represents a separate subsubline).
FIG. 4
FIG. 4
Comparison of growth rates of scrapie-infected and uninfected cell lines. The graphs depict the results of two similar experiments. Cells were grown in 96-well plates. The number of viable cells were measured at each time point by the thiazolyl blue (MTT) assay. Each point represents the ratio of the mean absorbance (abs.) of 12 wells of scrapie-infected cells to the mean absorbance of 12 wells of the cognate uninfected cells. Measurements were taken at 1, 3, and 5 days. Each error bar represents the total relative standard deviation for the ratio. (A) A single prion-infected population from two different susceptible sublines is compared to its uninfected cognate line. (B) Two separately infected populations were derived from two different susceptible sublines (the two lines indicated by open symbols and solid symbols) are compared to the cognate uninfected population. A positively sloping line in either figure would indicate relatively faster growth in the scrapie-infected cells. The cell density increases each day in both scrapie-infected and uninfected populations (data not shown), but no consistent difference in the growth rates is seen between infected and uninfected sublines. The MTT assay was performed per the supplier's instructions (Sigma).
FIG. 5
FIG. 5
Time course of accumulation of PrPSc in inoculated susceptible cells. A susceptible subline, N2a.AI.17, was inoculated with 20 μl of a 10% brain homogenate from an RML-infected CD-1 mouse (left column) or with 20 μl of ScN2a cells (107 cells/ml) (right column). At intervals after inoculation, cells were passaged and aliquots were plated for cell blotting. After 7 days (the first passage), a strong signal, thought to represent residual inoculum, was seen (not shown). The signal at day 11 may represent residual inoculum or de novo PrPSc formation. Increasing amounts of PrPSc after day 11 indicate de novo formation of PrPSc. By day 34, the amount of PrPSc in the culture inoculated with ScN2a homogenate approaches that of cloned ScN2a cells.
FIG. 6
FIG. 6
Effect of growth medium on susceptibility to scrapie infection. Cultures of a prion-susceptible N2a subline were inoculated with dilutions of a homogenate of ScN2a cells (107 cell/ml) and passaged in the indicated medium for 22 to 30 days before blotting. (A) Cultures inoculated and grown in high-glucose DMEM (DME) or MEM. PrPSc is detectable in cells grown in DMEM at a 2-log-unit dilution of the inoculum, but in cells grown in MEM, PrPSc is detected only in the undiluted inoculum. (B) Cultures inoculated and grown in high-glucose DMEM or MEM and then grown in high-glucose DMEM for 4 days prior to blotting. (C) Cultures grown for several weeks in either MEM or high-glucose DMEM and then switched to the other medium prior to inoculation. Uninoc., uninoculated.
FIG. 7
FIG. 7
Comparison of the cell blot densities of a susceptible N2a line grown in high-glucose DMEM or MEM. Cultures were inoculated with ScN2a cell homogenate. The amount inoculated is expressed as an estimate of the mouse ID50 titer, based on previous studies of ScN2a cells (4). Cell blotting was performed 25 days after inoculation. Density measurements were made using NIH Image software on scanned images of cell blots. Measurements were normalized by determining the ratio of the density of the blot to the mean density of blots of uninoculated cells on the same membrane. Each data point represents the average measurements of four separate cell blots and is expressed as a mean percent above background density [(normalized density − 1) × 100]. Error bars show the total relative standard deviation for the normalized density calculation. For cells grown in DMEM (solid squares), Student's t-test gives P values of 0.01 or lower for comparisons between any of the three inoculation titers and mean. However, for cells grown in MEM (open diamonds), P values are less than 0.05 only for the group receiving the highest inoculum titer. Thus, cell blot sensitivity is 1 to 2 log ID50 units greater for cells grown in DMEM than for cells grown in MEM.
FIG. 8
FIG. 8
N2a and GT1-trk cells are resistant to infection with the ME7 strain of prions. (A) PrPSc was concentrated from RML- or ME7-infected mouse brains using phosphotungstic acid (PTA), as described in Materials and Methods. The Western blot compares 5 μl of 5% brain homogenate (H) to 5 μl of a 60-ml resuspension of the PTA-precipitated pellet (P) for both RML and ME7. Note that only PTA-precipitated samples were treated with proteinase K. The precipitation markedly increases the concentration of PrPSc. (B) Cell blots of GT1-trk and N2a.F13.18 cells exposed to PTA-concentrated RML 22 days before blotting. (C) GT1-trk and N2a.F13.18 cells exposed to PTA-concentrated ME7 22 days before blotting. No proteinase K-resistant PrP is seen in any ME7-inoculated culture, while all RML-inoculated N2a.F13.18 cultures and 50- and 5-ml RML-inoculated GT1-trk cultures are infected. Background staining is higher with GT1-trk cells than with N2a cells (compare the blots of uninoculated cultures).
FIG. 9
FIG. 9
Comparison of methods for deriving scrapie-infected cell cultures. In this schematic representation, different shapes depict the (presumably) genetic heterogeneity in the population of cultured cells. Triangles represent cells highly susceptible to prion infection, pentagons represent cells of intermediate susceptibility, and circles represent prion-resistant cells. The intensity of the red color represents the amount of PrPSc produced in a cell. In the traditional method (top), a population of cells (a) is inoculated with prions. Typically, the level of PrPSc in the inoculated culture (b) is low, necessitating a cloning step (c). The clonal population which is isolated may be representative of a minority of the cells in the heterogeneous parent culture, invalidating comparisons between the scrapie-infected clone (d) and the parent culture (a). In our improved approach (bottom), clonal populations (f) are derived from the parent culture before inoculation. These clonal populations vary in susceptibility to prion infection. Most or all cells in the most susceptible clonal populations will produce PrPSc upon inoculation with prions (g). These can be compared to the uninoculated cognate line (f) without artifacts due to cloning.

Similar articles

Cited by

References

    1. Baguley B C, Marshall E S, Whittaker J R, Dotchin M C, Nixon J, McCrystal M R, Finlay G J, Matthews J H, Holdaway K M, van Zijl P. Resistance mechanisms determining the in vitro sensitivity to paclitaxel of tumour cells cultured from patients with ovarian cancer. Eur J Cancer. 1995;31A:230–237. - PubMed
    1. Borchelt D R, Scott M, Taraboulos A, Stahl N, Prusiner S B. Scrapie and cellular prion proteins differ in their kinetics of synthesis and topology in cultured cells. J Cell Biol. 1990;110:743–752. - PMC - PubMed
    1. Bruce M E, McBride P A, Farquhar C F. Precise targeting of the pathology of the sialoglycoprotein, PrP, and vacuolar degeneration in mouse scrapie. Neurosci Lett. 1989;102:1–6. - PubMed
    1. Butler D A, Scott M R D, Bockman J M, Borchelt D R, Taraboulos A, Hsiao K K, Kingsbury D T, Prusiner S B. Scrapie-infected murine neuroblastoma cells produce protease-resistant prion proteins. J Virol. 1988;62:1558–1564. - PMC - PubMed
    1. Caughey B, Race R E. Potent inhibition of scrapie-associated PrP accumulation by Congo red. J Neurochem. 1992;59:768–771. - PubMed