. 2000 Mar;27(3):558-67.
doi: 10.1118/1.598895.

Full breast digital mammography with an amorphous silicon-based flat panel detector: physical characteristics of a clinical prototype

Affiliations

Full breast digital mammography with an amorphous silicon-based flat panel detector: physical characteristics of a clinical prototype

S Vedantham et al. Med Phys. 2000 Mar.

Abstract

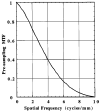
The physical characteristics of a clinical prototype amorphous silicon-based flat panel imager for full-breast digital mammography have been investigated. The imager employs a thin thallium doped CsI scintillator on an amorphous silicon matrix of detector elements with a pixel pitch of 100 microm. Objective criteria such as modulation transfer function (MTF), noise power spectrum, detective quantum efficiency (DQE), and noise equivalent quanta were employed for this evaluation. The presampling MTF was found to be 0.73, 0.42, and 0.28 at 2, 4, and 5 cycles/mm, respectively. The measured DQE of the current prototype utilizing a 28 kVp, Mo-Mo spectrum beam hardened with 4.5 cm Lucite is approximately 55% at close to zero spatial frequency at an exposure of 32.8 mR, and decreases to approximately 40% at a low exposure of 1.3 mR. Detector element nonuniformity and electronic gain variations were not significant after appropriate calibration and software corrections. The response of the imager was linear and did not exhibit signal saturation under tested exposure conditions.


Figures

Fig. 1
Fig. 1
Schematic of the amorphous silicon detector array.
Fig. 2
Fig. 2
Experimental setup for MTF measurement. The area surrounding the 10 μm slit was covered with Pb (0.5 cm thick).
Fig. 3
Fig. 3
Illustration of slit image correction for variations in slit width.
Fig. 4
Fig. 4
The pixel amplitudes along the anode–cathode axis used for determining the number of rows of data needed to obtain a finely sampled LSF.
Fig. 5
Fig. 5
Finely sampled LSF.
Fig. 6
Fig. 6
Experimental setup for NPS measurement where a 4 cm×4 cm area of the detector centered at 4 cm from the chest wall edge was irradiated. Lead collimation at the tube port and at the detector surface reduced excessive scatter.
Fig. 7
Fig. 7
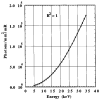
Curve fitted x-ray photon fluence per mR between the energy range of 5 and 35 keV obtained from published values.
Fig. 8
Fig. 8
The presampling MTF of the full field flat panel a:Si imager.
Fig. 9
Fig. 9
Linearity of the system. The data points represent the mean intensity and the error bars represent the standard deviation from this mean value.
Fig. 10
Fig. 10
The 2D NPS obtained at 1.3, 7.1, 14.5, and 32.8 mR are shown in (a), (b), (c), and (d), respectively. The intersection of the axes has been masked for display purposes. The images are displayed in a black and white scheme, with the transition point set at the mean of the ROI.
Fig. 11
Fig. 11
The 1D noise power spectra (NPSraw) at four exposure levels of 1.3, 7.1, 14.5, and 32.8 mR are shown. The electronic noise is also shown.
Fig. 12
Fig. 12
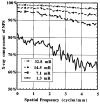
The x-ray component of NPSraw at four exposure levels of 1.3, 7.1, 14.5, and 32.8 mR are shown.
Fig. 13
Fig. 13
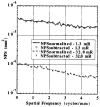
The 1D NPSnormalized and NPSsubtracted obtained at 1.3 and 32.8 mR.
Fig. 14
Fig. 14
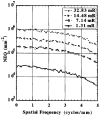
The NEQ of the system at four exposure levels.
Fig. 15
Fig. 15
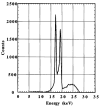
The Mo–Mo spectra incident on the detector transmitted through 4.5 cm of Lucite and the breast support plate, recorded with a high resolution spectrometer for calculation of q.
Fig. 16
Fig. 16
The DQE of the system at four exposure levels. Data points are curve fitted with a sixth-order polynomial for clarity. To demonstrate the goodness of fit, data points at an exposure of 1.3 mR are shown.
Fig. 17
Fig. 17
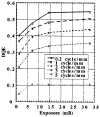
DQE of the system plotted as a function of incident exposure.

References

    1. Chakraborty DP. The effect of the antiscatter grid on full-field digital mammography phantom images. J Digit Imaging. 1999;12:12–22. - PMC - PubMed
    1. Jing Z, Huda W, Walker JK. Scattered radiation in scanning slot mammography. Med Phys. 1998;25:1111–1117. - PubMed
    1. Persliden J, Carlsson GA. Scatter rejection by air gaps in diagnostic radiology. Calculations using a Monte Carlo collision density method and consideration of molecular interference in coherent scattering. Phys Med Biol. 1997;42:155–175. - PubMed
    1. Fahrig R, Mainprize JG, Robert N, Rogers A, Yaffe MJ. Performance of glass fiber antiscatter devices at mammographic energies. Med Phys. 1994;21:1277–1282. - PubMed
    1. Roehrig H, Yu T, Krupinski E. Image quality control for digital mammographic systems: initial experience and outlook. J Digit Imaging. 1995;8:52–66. - PubMed

Publication types