. 2000 May;20(9):3224-33.
doi: 10.1128/MCB.20.9.3224-3233.2000.

Stress signals utilize multiple pathways to stabilize p53

Affiliations

Stress signals utilize multiple pathways to stabilize p53

M Ashcroft et al. Mol Cell Biol. 2000 May.

Abstract

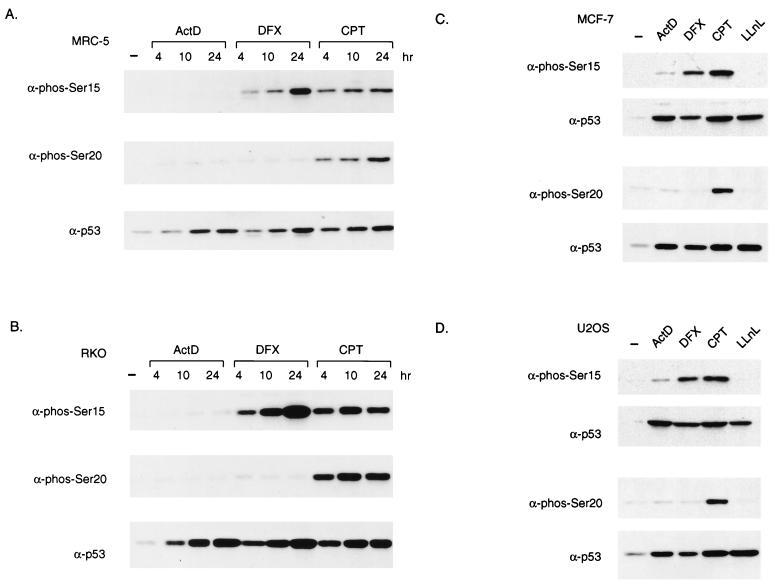
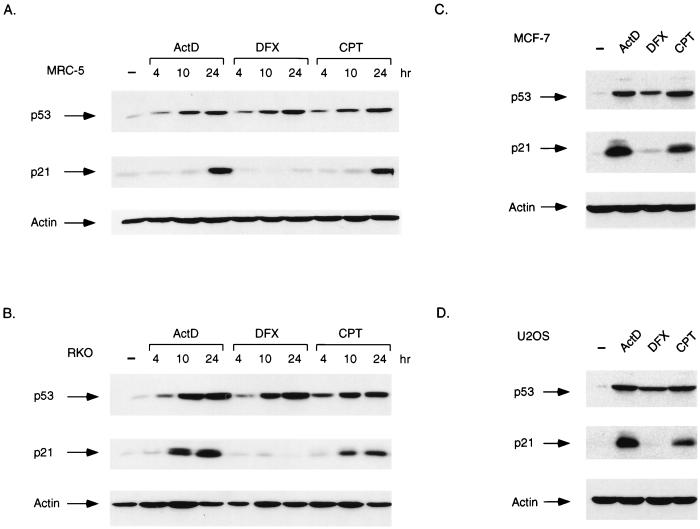
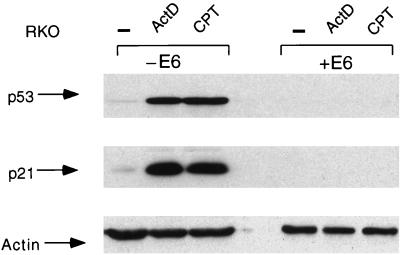
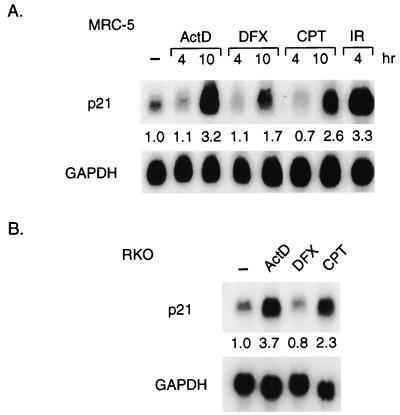
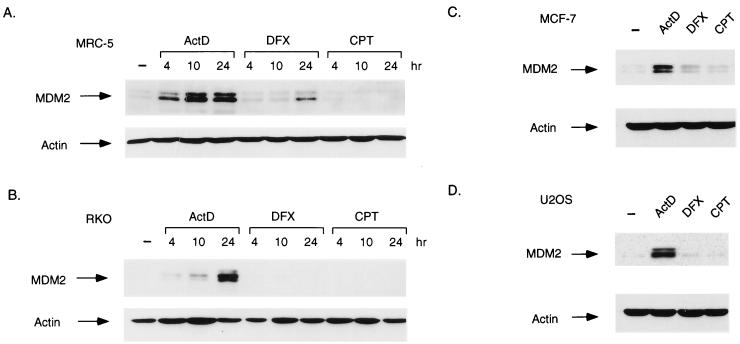
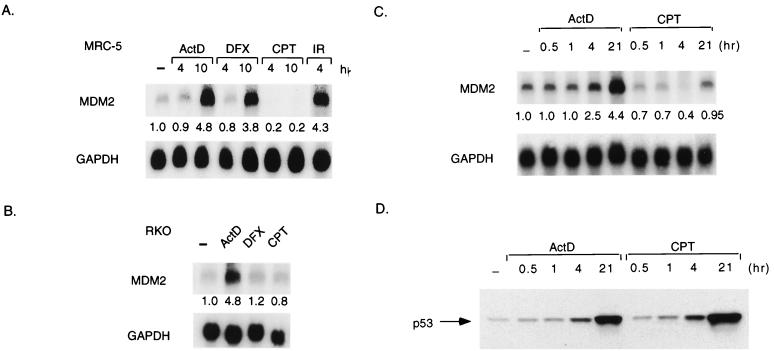
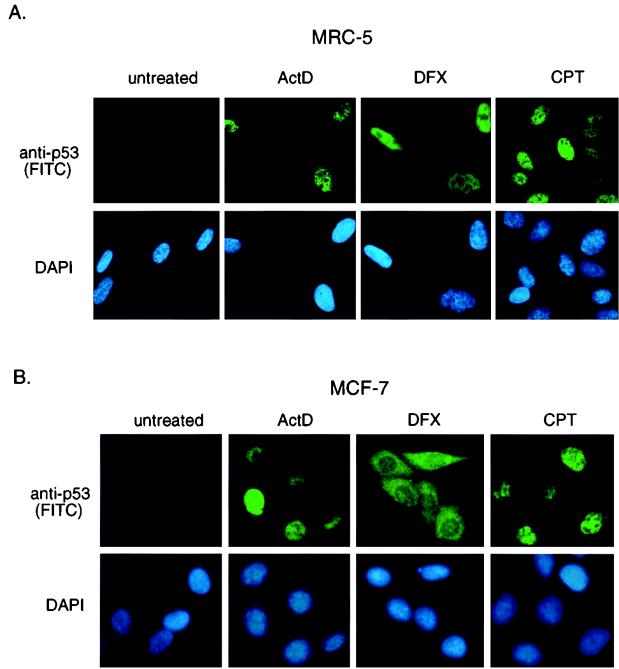
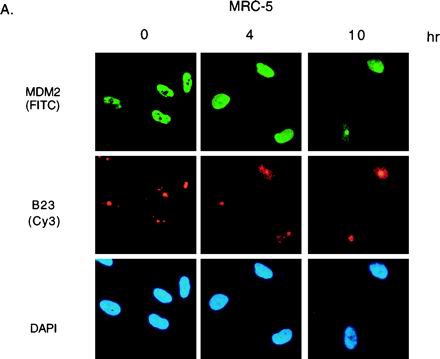
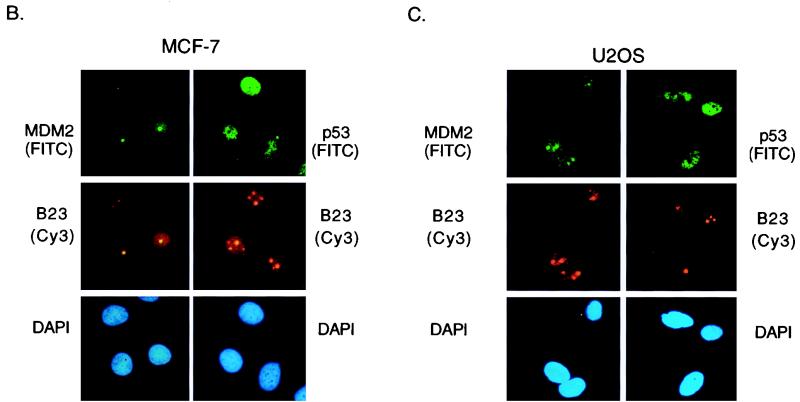
The p53 tumor suppressor is activated by many diverse stress signals through mechanisms that result in stabilization and accumulation of the p53 protein. p53 is normally degraded through the proteasome following interaction with MDM2, which both functions as a ubiquitin ligase for p53 and shuttles to the cytoplasm, where p53 degradation occurs. Stabilization of p53 in response to stress is associated with inhibition of MDM2-mediated degradation, which has been associated with phosphorylation of p53 in response to DNA damage or activation of ARF. In this study we show distinct responses, as measured by phosphorylation, transcriptional activity, and subcellular localization, of p53 stabilized by different activating signals. Although normal cells and wild-type p53-expressing tumor cells showed similar responses to actinomycin D and camptothecin treatment, the transcriptional activity of stabilized p53 induced by deferoxamine mesylate, which mimics hypoxia, in normal cells was lost in all three tumor cell lines tested. Our results show that multiple pathways exist to stabilize p53 in response to different forms of stress, and they may involve down-regulation of MDM2 expression or regulation of the subcellular localization of p53 or MDM2. Loss of any one of these pathways may predispose cells to malignant transformation, although reactivation of p53 might be achieved through alternative pathways that remain functional in these tumor cells.


Figures

FIG. 1
FIG. 1
p53 is stabilized and differentially phosphorylated in response to different stress signals. (A and B) Western blot analysis of p53 protein immunoprecipitated from MRC-5 (A) or RKO (B) cells harvested at the indicated time points after treatment with actinomycin D (ActD; 5 nM), CPT (2 μM), or DFX (500 or 250 μM, respectively). The blots were probed with phosphoserine 15- or phosphoserine 20-specific antibodies (α-phos-Ser15 or -20) or PAb1801 (α-p53) to detect total p53 levels. (B) Western blot analysis of p53 protein immunoprecipitated from RKO cells harvested at the indicated time points after treatment with actinomycin D (5 nM), CPT (2 μM), or DFX (250 μM). The blots were probed with phosphoserine 15- or phosphoserine 20-specific antibodies or PAb1801 to detect total p53 levels. (C and D) Western blot analysis of Ser15 and Ser20 phosphorylation of immunoprecipitated p53 protein from MCF-7 (C) or U2OS (D) cell harvested 24 h after treatment with actinomycin D (5 nM), CPT (2 μM), DFX (250 μM), or LLnL (10 μM). The blots were probed with antibodies as described for panel A. −, no treatment.
FIG. 2
FIG. 2
Activation of p21Waf1/Cip1 protein expression. (A) Western blot analysis of p53 and p21Waf1/Cip1 protein levels in MRC-5 cells harvested at the indicated times after treatment with actinomycin D (ActD; 5 nM), DFX (500 μM), or CPT (2 μM). The blots were reprobed for actin expression as a loading control. (B) Western blot analysis of p53 and p21Waf1/Cip1 protein levels in RKO cells harvested at the indicated times after treatment with actinomycin D (5 nM), DFX (250 μM), or CPT (2 μM). The blots were reprobed for actin expression as a loading control. (C) Western blot analysis of p53 and p21Waf1/Cip1 protein levels in MCF-7 cells harvested 24 h after treatment with actinomycin D (5 nM), DFX (250 μM), or CPT (2 μM). The blots were reprobed for actin expression as a loading control. (D) Western blot analysis of p53 and p21Waf1/Cip1 protein levels in U2OS cells harvested 24 h after treatment with actinomycin D (5 nM), DFX (250 μM), or CPT (2 μM). The blots were reprobed for actin expression as a loading control. −, no treatment.
FIG. 3
FIG. 3
Activation of p21Waf1/Cip1 protein expression in response to CPT is p53 dependent. Western blot analysis of p53 (upper blot) and p21Waf1/Cip1 (middle blot) protein levels in RKO cells (−E6) and RKO cells stably expressing human papillomavirus E6 (+E6) harvested 24 h after treatment with or without actinomycin D (ActD; 5 nM) or CPT (2 μM). To assess protein loading, the Western blots were reprobed with antiactin antibody (lower blot). −, no treatment.
FIG. 4
FIG. 4
Activation of p21Waf1/Cip1 transcription. (A) Northern blot analysis of p21Waf1/Cip1 mRNA levels in MRC-5 cells harvested at the indicated times after treatment with actinomycin D (ActD; 5 nM), DFX (500 μM), CPT (2 μM), or IR (10 Gy). The blots were reprobed for GAPDH expression as a loading control. Quantification of the signal relative to the GAPDH control was expressed as a ratio of the signal in untreated cells (shown under each lane). (B) Northern blot analysis of p21Waf1/Cip1 mRNA levels in RKO cells harvested 21 h after treatment with actinomycin D (5 nM), DFX (250 μM), or CPT (2 μM). The blots were reprobed for GAPDH expression as a loading control. Quantification of the signal relative to the GAPDH control was expressed as a ratio of the signal in untreated cells (shown under each lane). −, no treatment.
FIG. 5
FIG. 5
Activation of MDM2 protein expression. (A) Western blot analysis of MDM2 protein levels in MRC-5 cells harvested at the indicated times after treatment with actinomycin D (ActD; 5 nM), DFX (500 μM), or CPT (2 μM). The blots were reprobed for actin expression as a loading control. (B) Western blot analysis of MDM2 protein levels in RKO cells harvested at the indicated times after treatment with actinomycin D (5 nM), DFX (250 μM), or CPT (2 μM). The blots were reprobed for actin expression as a loading control. (C) Western blot analysis of MDM2 protein levels in MCF-7 cells harvested 24 h after treatment with actinomycin D (5 nM), DFX (250 μM), or CPT (2 μM). The blots were reprobed for actin expression as a loading control. (D) Western blot analysis of MDM2 protein levels in U2OS cells harvested 24 h after treatment with actinomycin D (5 nM), DFX (250 μM), or CPT (2 μM). The blots were reprobed for actin expression as a loading control. −, no treatment.
FIG. 6
FIG. 6
Activation of MDM2 mRNA expression. (A) Northern blot analysis of MDM2 mRNA levels in MRC-5 cells harvested at the indicated times after treatment with actinomycin D (ActD; 5 nM), DFX (500 μM), CPT (2 μM), or IR (10 Gy). The blots were reprobed for GAPDH expression as a loading control. Quantification of the signal relative to the control is shown under each lane. (B) Northern blot analysis of MDM2 mRNA levels in RKO cells harvested 21 h after treatment with actinomycin D (ActD; 5 nM), DFX (250 μM), or CPT (2 μM). The blots were reprobed for GAPDH expression as a loading control. Quantification of the signal relative to the GAPDH control was expressed as a ratio of the signal in untreated cells (shown under each lane). (C) Northern blot analysis of human MDM2 mRNA from RKO cells harvested after treatment with or without actinomycin D (5 nM) or CPT (2 μM) at the times indicated. The Northern blots were stripped and then hybridized with a human GAPDH cDNA probe to assess loading. Quantification of the signal relative to the GAPDH control was expressed as a ratio of the signal in untreated cells (shown under each lane). (D) Western blot analysis of p53 protein from RKO cells after treatment as described for panel C. −, no treatment.
FIG. 7
FIG. 7
Subcellular localization of p53. (A) Immunofluorescence staining of MRC-5 cells at 10 h after treatment with actinomycin D (ActD; 5 nM), DFX (500 μM), or CPT (2 μM). Localization of human p53 protein was assessed using DO1 and visualized using an FITC-conjugated secondary antibody. Cells were counterstained with DAPI to localize the nucleus. (B) Immunofluorescence staining of MCF-7 cells at 10 h after treatment with actinomycin D (5 nM), DFX (250 μM), or CPT (2 μM). Localization of human p53 protein was assessed as described for panel A.
FIG. 8
FIG. 8
Subnuclear localization of MDM2. (A) Immunofluorescence staining of MRC-5 cells, pretreated for 3 h with LLnL to stabilize MDM2 and harvested at the indicated times after treatment with 5 nM actinomycin D. Colocalization of MDM2 (AB-1) visualized using an FITC-conjugated secondary antibody with B23 protein visualized using a Cy3-conjugated secondary antibody is shown; the cells were counterstained with DAPI to localize the nucleus. (B) Immunofluorescence staining of MCF-7 cells 10 h after treatment with 5 nM actinomycin D. Colocalization of MDM2 (AB-1) or p53 (DO1) with B23 protein is shown. The cells were counterstained with DAPI to localize the nucleus. (C) Immunofluorescence staining of U2OS cells 16 h after treatment with 5 nM actinomycin D. Colocalization of MDM2 (AB-1) or p53 (DO1) with B23 protein is shown. The cells were counterstained with DAPI to localize the nucleus.
FIG. 8
FIG. 8
Subnuclear localization of MDM2. (A) Immunofluorescence staining of MRC-5 cells, pretreated for 3 h with LLnL to stabilize MDM2 and harvested at the indicated times after treatment with 5 nM actinomycin D. Colocalization of MDM2 (AB-1) visualized using an FITC-conjugated secondary antibody with B23 protein visualized using a Cy3-conjugated secondary antibody is shown; the cells were counterstained with DAPI to localize the nucleus. (B) Immunofluorescence staining of MCF-7 cells 10 h after treatment with 5 nM actinomycin D. Colocalization of MDM2 (AB-1) or p53 (DO1) with B23 protein is shown. The cells were counterstained with DAPI to localize the nucleus. (C) Immunofluorescence staining of U2OS cells 16 h after treatment with 5 nM actinomycin D. Colocalization of MDM2 (AB-1) or p53 (DO1) with B23 protein is shown. The cells were counterstained with DAPI to localize the nucleus.

References

    1. An W G, Kanekal M, Simon M C, Maltepe E, Blagosklonny M V, Neckers L M. Stabilization of wild-type by hypoxia-inducible factor 1alpha. Nature. 1998;392:405–408. - PubMed
    1. Arriola E L, Rodriguez Lopez A, Chresta C M. Differential regulation of p21waf-1/cip-1 and Mdm2 by etoposide: etoposide inhibits the p53-Mdm2 autoregulatory loop. Oncogene. 1999;18:1081–1091. - PubMed
    1. Ashcroft M, Kubbutat M H, Vousden K H. Regulation of p53 function and stability by phosphorylation. Mol Cell Biol. 1999;19:1751–1758. - PMC - PubMed
    1. Ashcroft M, Vousden K H. Regulation of p53 stability. Oncogene. 1999;18:7637–7643. - PubMed
    1. Banin S, Moyal L, Shieh S-Y, Taya Y, Anderson C W, Chessa L, Smorodinsky N I, Prives C, Reiss Y, Shiloh Y, Ziv Y. Enhanced phosphorylation of p53 by ATM in response to DNA damage. Science. 1998;281:1674–1677. - PubMed

Publication types

MeSH terms