. 2000 Apr;122(4):1323-33.
doi: 10.1104/pp.122.4.1323.

Programmed cell death during pollination-induced petal senescence in petunia

Affiliations

Programmed cell death during pollination-induced petal senescence in petunia

Y Xu et al. Plant Physiol. 2000 Apr.

Abstract

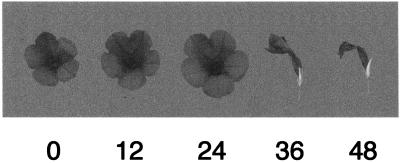
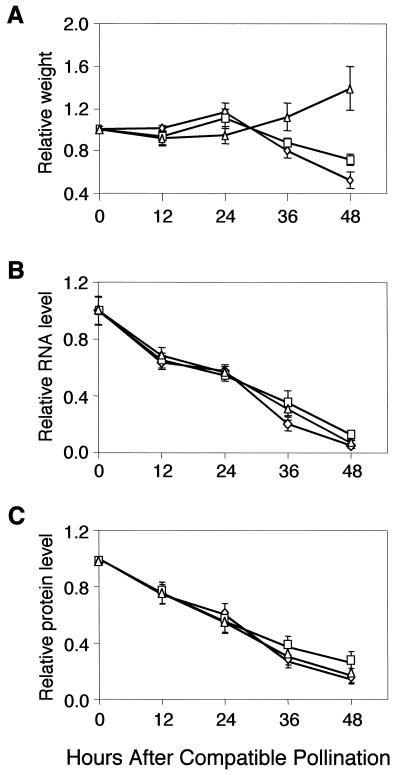
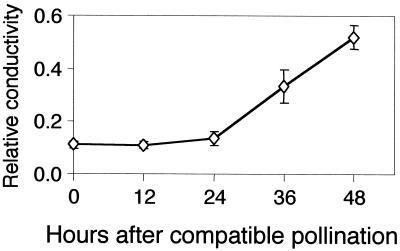
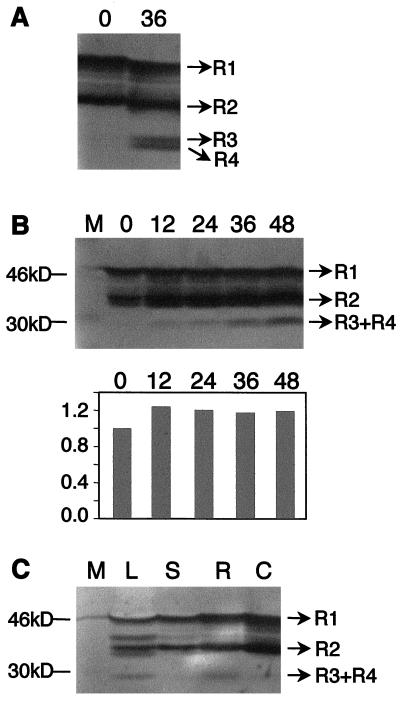
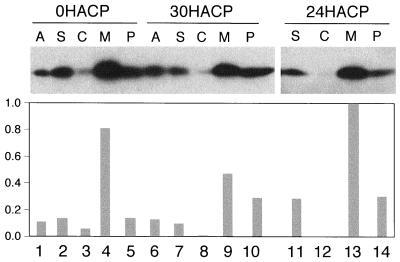
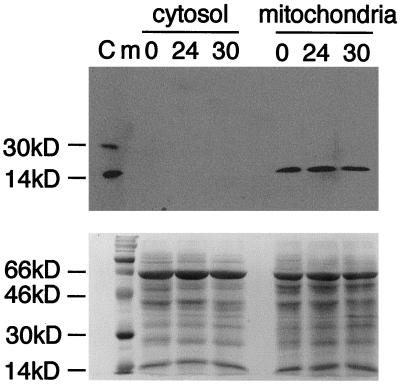
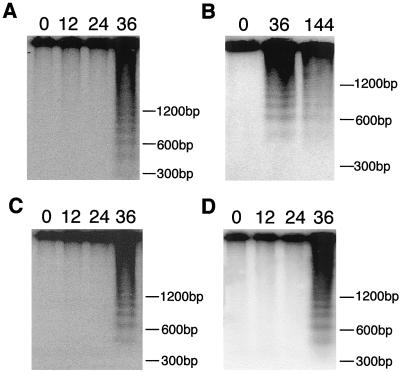
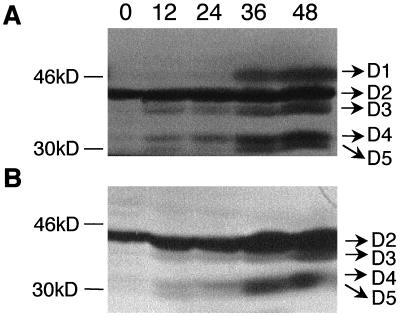
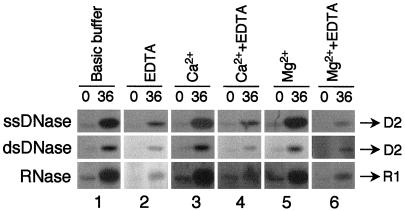
Petal senescence, one type of programmed cell death (PCD) in plants, is a genetically controlled sequence of events comprising its final developmental stage. We characterized the pollination-induced petal senescence process in Petunia inflata using a number of cell performance markers, including fresh/dry weight, protein amount, RNA amount, RNase activity, and cellular membrane leakage. Membrane disruption and DNA fragmentation with preferential oligonucleosomal cleavage, events characteristic of PCD, were found to be present in the advanced stage of petal senescence, indicating that plant and animal cell death phenomena share one of the molecular events in the execution phase. As in apoptosis in animals, both single-stranded DNase and double-stranded DNase activities are induced during petal cell death and are enhanced by Ca(2+). In contrast, the release of cytochrome c from mitochondria, one commitment step in signaling of apoptosis in animal cells, was found to be dispensable in petal cell death. Some components of the signal transduction pathway for PCD in plants are likely to differ from those in animal cells.


Figures

Figure 1
Figure 1
Effect of compatible pollination on petal senescence in P. inflata. Flowers of P. inflata-1 were pollinated by pollen from P. inflata P-S-14 on the day of flower opening. 0, 12, 24, 36, and 48, HACP.
Figure 2
Figure 2
Effects of compatible pollination on weight (A), protein (B), and RNA (C). Eight corollas were taken at each time point for different measurements. The average result of six independent pollination experiments was presented. For the data per corolla, data were recalculated based on the average fresh weight at each time point in order to make different parameters more comparable. Data are shown as a ratio of the parameter at the time point versus the parameter at time of flower opening. Error bars indicate the sd. 0, 12, 24, 36, and 48, HACP. A, ⋄, Fresh weight/corolla; □, dry weight/corolla; ▵, dry weight/fresh weight. B, ⋄, RNA/corolla; □, RNA/unit fresh weight; ▵, RNA/unit dry weight. C, ⋄, Protein/corolla; □, protein/unit fresh weight; ▵, protein/unit dry weight.
Figure 3
Figure 3
Relative conductivity profile after compatible pollination. Each time point represents 56 corollas, with eight corollas taken for each time point during seven different experiments. Relative conductivity is the ratio of sample conductivity to total conductivity (see “Materials and Methods”). sd is indicated as error bars on the average data.
Figure 4
Figure 4
Characterization of RNase activities during petal senescence. Fifty micrograms of total corolla protein from different time points was used for RNase detection. Petunia total RNA was incorporated into the resolving gel at 40 μg/mL. A, Detection of RNase activities in open corollas and corollas at 36 HACP on 12% SDS-PAGE. B, Time course induction of RNases separated on 10% SDS-PAGE after compatible pollination over the senescing period (top). The bottom bar graph shows densitometry data of the total activity of R1 and R2 relative to the activity in open flowers. C, Tissue-specific expression of RNases on a 10% SDS-PAGE gel. M, Rainbow marker; L, young leaf; S, young stem; R, root; C, corolla from open flowers; 0, 12, 24, 36, and 48, HACP.
Figure 5
Figure 5
Abundance of Cyt c in cellular fractions at flower opening and following compatible pollination. Immunoblot of a 12% SDS-PAGE gel was probed with a monoclonal anti-Cyt c antibody. A, Crude petal extract; S, 1,500g supernatant (extract devoid of nuclei and chloroplasts); C, 16,000g supernatant (cytosol); M, 16,000g pellet (mitochondria); and P, 1,500g pellet (nucleus and chloroplast). Bar graph indicates comparative densitometry data of the Cyt c signal with the highest signal in mitochondria as 1.
Figure 6
Figure 6
Distribution of Cyt c during pollination-induced petal senescence. Immunoblot of a 12% SDS-PAGE gel probed with a monoclonal anti-Cyt c antibody (top). The bottom panel shows Ponceau staining of the same gel as a loading control. Bovine Cyt c (40 ng, lane C) was used as a positive control (15 kD). m, Rainbow marker; 0, 24, and 30, HACP.
Figure 7
Figure 7
Analysis of P. inflata for DNA fragmentation. Equal amounts of genomic DNA (2 μg for A–C; 8 μg for D) were separated on a 2% (w/v) agarose gel and then transferred to a nylon membrane. The membrane was probed with Sau3A1-digested P. inflata genomic DNA (A and B), a Petunia repetitive DNA (C), and Brassica 25S rDNA (D). 0, 12, 24, and 36, HACP; 144, hours after flower opening.
Figure 8
Figure 8
Characterization of ssDNase and dsDNase activities during petal senescence. Fifty micrograms of total corolla protein from different time points was separated on a 10% (w/v) SDS-PAGE gel for ssDNase (A) and dsDNase (B) detection. Salmon DNA was used as the substrate. 0, 12, 24, 36, and 48, Hours after compatible pollination.
Figure 9
Figure 9
Effect of Ca2+ and Mg2+ on DNase D2 and RNase R1 activities in corolla tissue at 0 and 36 HACP. Ten micrograms of total corolla protein at 36 HACP was separated on 10% SDS-PAGE gels for detection of ssDNase (D2), dsDNase (D2), and RNase (R1). After renaturation, the protein gel was incubated in basic buffer or basic buffer plus one of the following: 1 mm EDTA, 1 mm CaCl2, 1 mm CaCl2 plus 1 mm EDTA, 1 mm MgCl2, and 1 mm MgCl2 plus 1 mm EDTA.

Similar articles

Cited by

References

    1. Blank A, McKeon TA. Three RNases in senescent and nonsenescent wheat leaves characterization by activity staining in sodium dodecyl sulfate-polyacrylamide gels. Plant Physiol. 1991;97:1402–1408. - PMC - PubMed
    1. Borochov A, Spiegelstein H, Philosoph HS. Ethylene and flower petal senescence: interrelationship with membrane lipid catabolism. Physiol Plant. 1997;100:606–612.
    1. Bortner CD, Oldenburg-Nicklas BE, Cidlowski JA. The role of DNA fragmentation in apoptosis. Trends Cell Biol. 1995;5:21–26. - PubMed
    1. Bossy WE, Newmeyer DD, Green DR. Mitochondrial cytochrome c release in apoptosis occurs upstream of DEVD-specific caspase activation and independently of mitochondrial transmembrane depolarization. EMBO J. 1998;17:37–49. - PMC - PubMed
    1. Cai J, Yang J, Jones DP. Mitochondrial control of apoptosis: the role of cytochrome c. Biochim Biophys Acta. 1998;1366:139–149. - PubMed

Publication types