. 2000 Apr;122(4):1343-53.
doi: 10.1104/pp.122.4.1343.

Subcellular localization and speciation of nickel in hyperaccumulator and non-accumulator Thlaspi species

Affiliations

Subcellular localization and speciation of nickel in hyperaccumulator and non-accumulator Thlaspi species

U Krämer et al. Plant Physiol. 2000 Apr.

Abstract

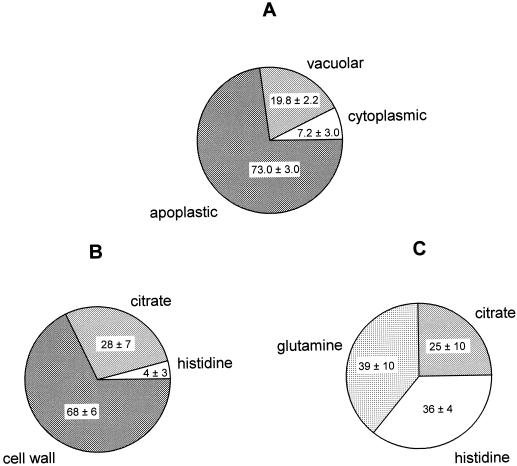
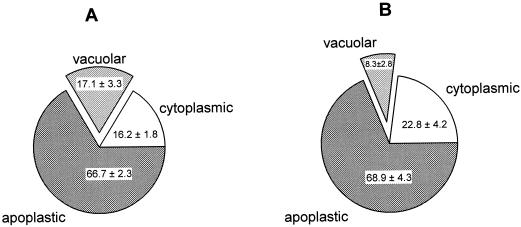
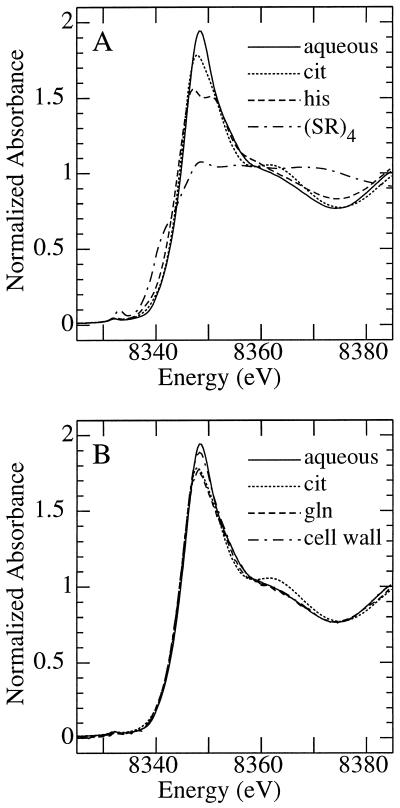
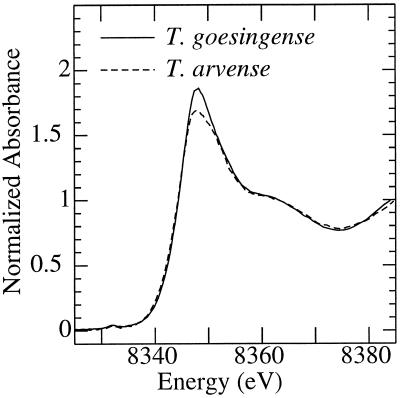
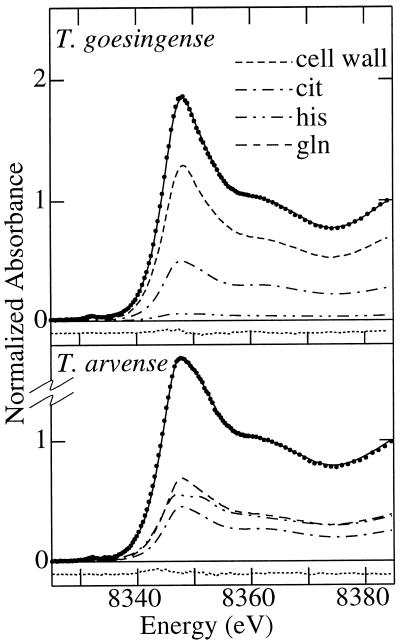
The ability of Thlaspi goesingense Hálácsy to hyperaccumulate Ni appears to be governed by its extraordinary degree of Ni tolerance. However, the physiological basis of this tolerance mechanism is unknown. We have investigated the role of vacuolar compartmentalization and chelation in this Ni tolerance. A direct comparison of Ni contents of vacuoles from leaves of T. goesingense and from the non-tolerant non-accumulator Thlaspi arvense L. showed that the hyperaccumulator accumulates approximately 2-fold more Ni in the vacuole than the non-accumulator under Ni exposure conditions that were non-toxic to both species. Using x-ray absorption spectroscopy we have been able to determine the likely identity of the compounds involved in chelating Ni within the leaf tissues of the hyperaccumulator and non-accumulator. This revealed that the majority of leaf Ni in the hyperaccumulator was associated with the cell wall, with the remaining Ni being associated with citrate and His, which we interpret as being localized primarily in the vacuolar and cytoplasm, respectively. This distribution of Ni was remarkably similar to that obtained by cell fractionation, supporting the hypothesis that in the hyperaccumulator, intracellular Ni is predominantly localized in the vacuole as a Ni-organic acid complex.


Figures

Figure 1
Figure 1
Subcellular localization and speciation of Ni in leaves of hyper- and non-accumulator Thlaspi species as a percentage of total leaf Ni. Plants were exposed to 10 μm Ni in a hydroponic solution for 7 d. Leaf samples were collected and used for protoplast and vacuole isolation (A) or analyzed for Ni speciation using x-ray absorption (B). A, Subcellular localization of Ni in T. goesingense as determined by cell fractionation. For each independent replicate experiment, leaf Ni concentrations (as nmol g−1 fresh biomass) and protoplast Ni concentrations (as Ni per 106 structures; primary data as summarized in Table III) were normalized to chlorophyll contents. Ni in the protoplast fractions was calculated as a percentage of total leaf Ni, and the remainder of leaf Ni was concluded to be localized in the apoplast. Ni contents of the vacuolar fractions of the protoplasts were calculated based on the assumption that one vacuole was released per protoplast, and are expressed as a percentage of total leaf Ni. The remainder of the protoplast Ni was concluded to be localized in the cytoplasm. Values are averages of percentages calculated individually for three independent replicate experiments ± sd. B, Major Ni species present in T. goesingense as determined by x-ray absorption spectroscopy. Values represent the percentage of total leaf Ni associated with each ligand ± 95% confidence limit. Total leaf Ni was 501 nmol g−1 fresh biomass. C, Major Ni species present in T. arvense as determined by x-ray absorption spectroscopy. Values represent the percentage of total leaf Ni associated with each ligand ± 95% confidence limit. Total leaf Ni was 310 nmol g−1 fresh biomass. X-ray absorption data were collected from a single representative plant sample for each species and each x-ray spectrum used for the fits represents the mean of three independent scans, each being composed of data acquired from 13 independent detectors.
Figure 2
Figure 2
Subcellular localization of Ni in leaves of hyper- and non-accumulator Thlaspi species as a percentage of total leaf Ni. Plants were exposed to 1 μm Ni (containing 40 μCi 63Ni per μmol Ni) in a hydroponic solution for 1 d. Leaf samples were collected and fractionated into protoplasts and intact vacuoles. Ni localization was calculated as described in Figure 1. Values were averaged from three independent experiments ± sd. A, Subcellular distribution of Ni in T. goesingense. B, Subcellular distribution of Ni in T. arvense.
Figure 3
Figure 3
X-ray absorption near-edge spectra of selected aqueous Ni species recorded at the Ni K-edge. The order of spectra plotted at the edge, from top to bottom, is as follows: A, Aqueous Ni2+ (6.66 mm Ni[NO3]2, pH 7.0), Ni-citrate (6.66 mm Ni[NO3]2 and 70 mm citrate, pH 8.0), Ni-His (6.66 mm Ni[NO3]2 and 80 mm His, pH 7.0), and (Ni[SPh]42−; Eidsness et al., 1989). B, Aqueous Ni2+ (6.66 mm Ni[NO3]2, pH 7.0), isolated T. goesingense shoot cell wall material (Lasat et al., 1996), Ni-citrate (6.66 mm Ni[NO3]2 and 70 mm citrate, pH 8.0), and Ni-Gln (1 mm Ni[NO3]2 and 4 mm Gln, pH 7.3).
Figure 4
Figure 4
Ni K-edge x-ray absorption near-edge spectra of shoots of T. goesingense (solid line) and T. arvense (broken line). Plants were grown hydroponically and exposed to 10 μm Ni for 7 d before harvest.
Figure 5
Figure 5
Results of quantitative modeling of x-ray absorption near-edge spectra obtained from shoots of T. goesingense and T. arvense. The spectrum of a mixture of Ni complexes is the sum of the spectra of all constituent complex species scaled by their relative proportional contribution to overall Ni chelation. By fitting spectra of aqueous Ni, Ni coordinated with His (6.66 mm Ni[NO3]2, 80 mm His, and 30% [v/v] glycerol, pH 7.0), citrate (6.66 mm Ni[NO3]2, 70 mm citrate, and 30% [v/v] glycerol, pH 8.0), Gln (1 mm Ni[NO3]2, 4 mm Gln, and 30% [v/v] glycerol, pH 7.3), and isolated T. goesingense shoot cell wall material (Lasat et al., 1996), we were able to determine the relative contribution of each compound as a ligand of Ni in planta (Fig. 1). A, T. goesingense shoots; relative goodness of fit of 0.06 × 10⁻³. B, T. arvense shoots; relative goodness of fit of 0.1 × 10⁻³. The figure shows the data (points), the best fit (solid line) and the residual (dotted line), together with the individual fractional contributions. The goodness of fit is defined as Σ[(Iobsd.Icalcd.)2 ]/n, where n is the number of points in the spectrum and Iobsd. and Icalcd are the observed and calculated points, respectively.

References

    1. Baker AJM, Brooks RR. Terrestrial higher plants which hyperaccumulate metallic elements: a review of their distribution, ecology and phytochemistry. Biorecovery. 1989;1:81–126.
    1. Brune A, Urbach W, Dietz K-J. Compartmentation and transport of zinc in barley primary leaves as basic mechanisms involved in zinc tolerance. Plant Cell Environ. 1994;17:153–162.
    1. Brune A, Urbach W, Dietz K-J. Differential toxicity of heavy metals is partly related to a loss of preferential extraplasmatic compartmentation: a comparison of Cd-, Mo-, Ni-, and Zn-stress. New Phytol. 1995;129:403–409.
    1. Chaney RL. Plant uptake of inorganic waste. In: Parr JE, Marsh PB, Kla JM, editors. Land Treatment of Hazardous Wastes. Park Ridge, IL: Noyes Data; 1983. pp. 50–76.
    1. Dawson RMC, Elliott DC, Elliott WH, Jones KM, editors. Data for Biochemical Research. Ed 3. Oxford, UK: Clarendon Press; 1986.

Publication types

MeSH terms

LinkOut - more resources