. 2000 Apr;122(4):1399-415.
doi: 10.1104/pp.122.4.1399.

The effects of elevated CO(2) concentrations on cell division rates, growth patterns, and blade anatomy in young wheat plants are modulated by factors related to leaf position, vernalization, and genotype

Affiliations

The effects of elevated CO(2) concentrations on cell division rates, growth patterns, and blade anatomy in young wheat plants are modulated by factors related to leaf position, vernalization, and genotype

J Masle. Plant Physiol. 2000 Apr.

Abstract

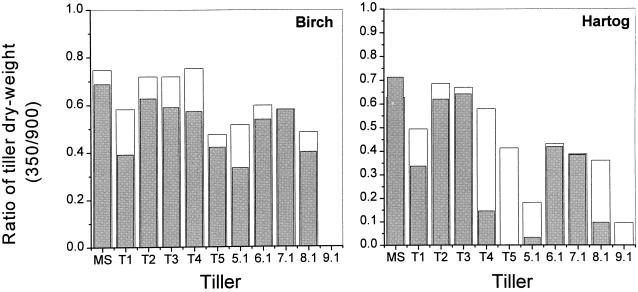
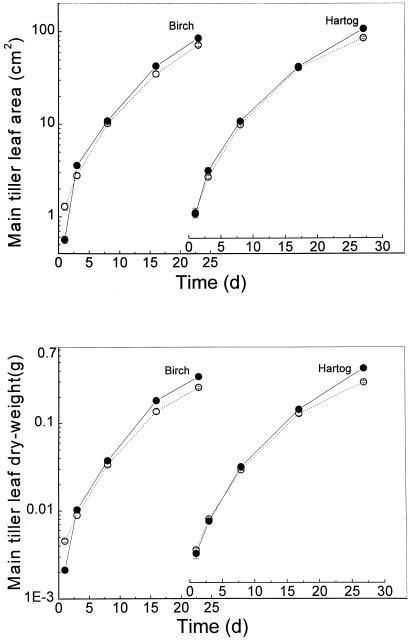
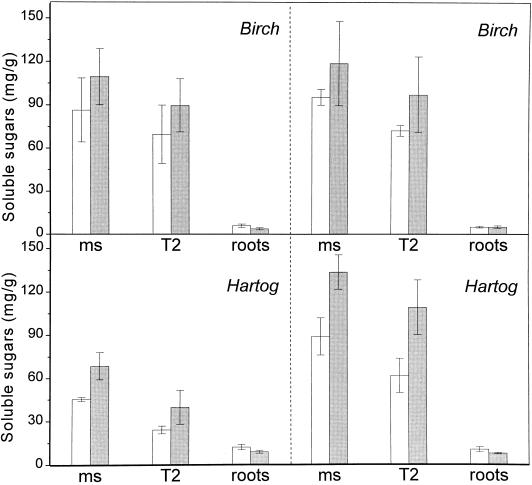
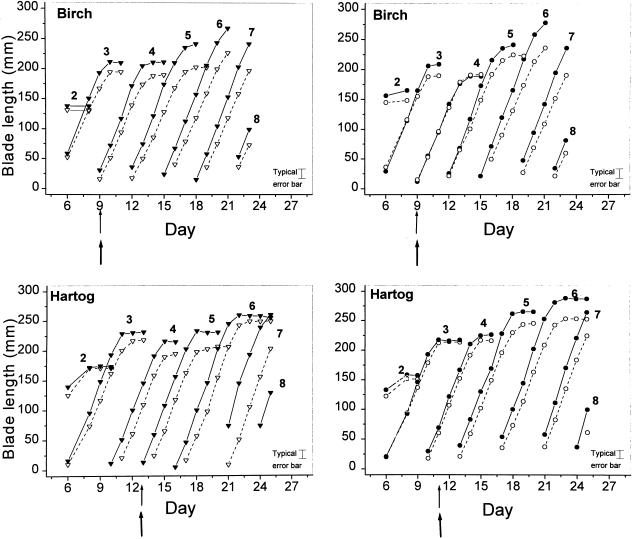
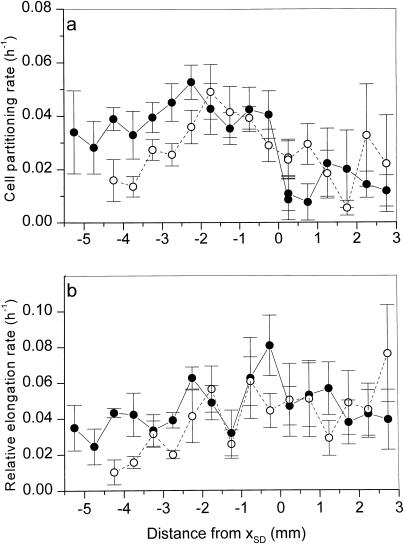
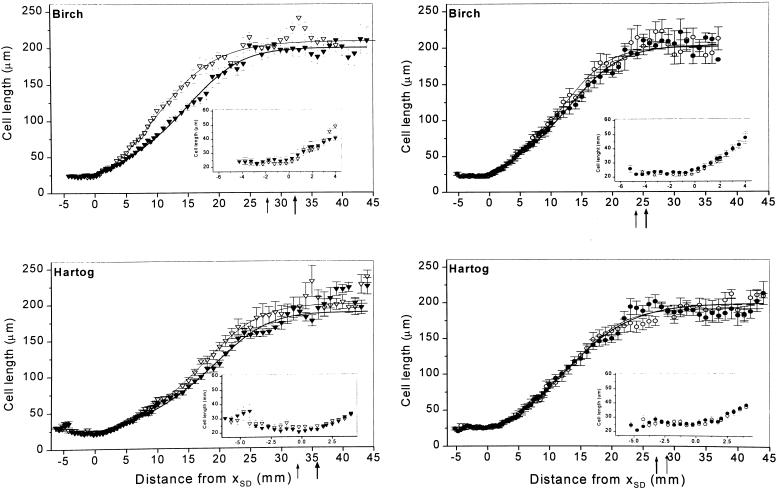
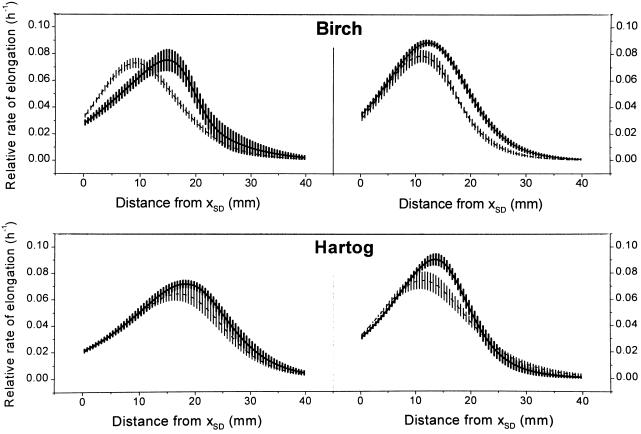
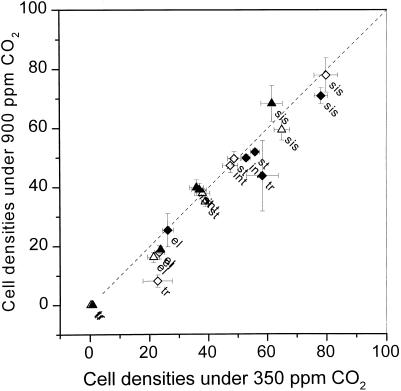
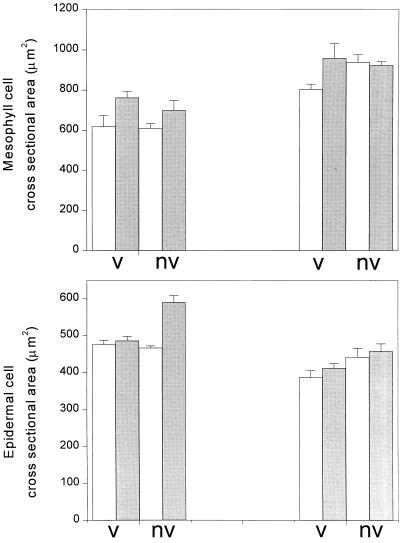
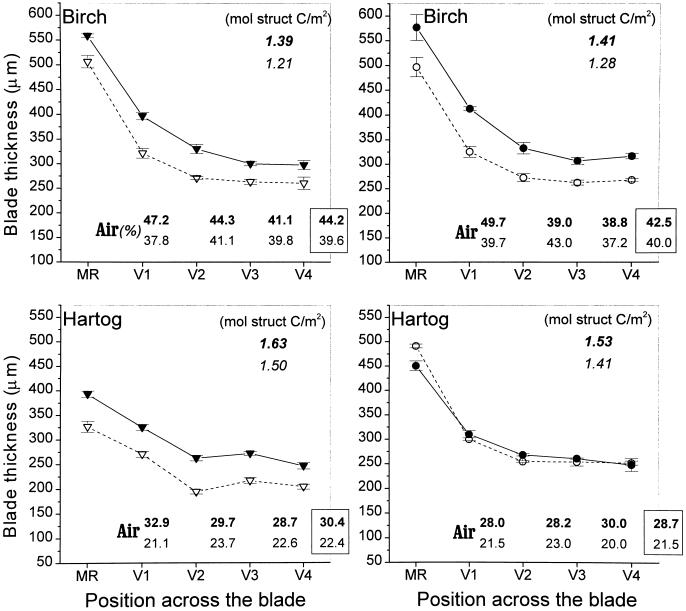
This study demonstrates that elevated [CO(2)] has profound effects on cell division and expansion in developing wheat (Triticum aestivum L.) leaves and on the quantitative integration of these processes in whole-leaf growth kinetics, anatomy, and carbon content. The expression of these effects, however, is modified by intrinsic factors related to genetic makeup and leaf position, and also by exposure to low vernalizing temperatures at germination. Beyond these interactions, leaf developmental responses to elevated [CO(2)] in wheat share several remarkable features that were conserved across all leaves examined. Most significantly: (a) the contribution of [CO(2)] effects on meristem size and activity in driving differences in whole-blade growth kinetics and final dimensions; (b) an anisotropy in cellular growth responses to elevated [CO(2)], with final cell length and expansion in the paradermal plane being highly conserved, even when the rates and duration of cell elongation were modified, while cell cross-sectional areas were increased; (c) tissue-specific effects of elevated [CO(2)], with significant modifications of mesophyll anatomy, including an increased extension of intercellular air spaces and the formation of, on average, one extra cell layer, while epidermal anatomy was mostly unaltered. Our results indicate complex developmental regulations of sugar effects in expanding leaves that are subjected to genetic variation and influenced by environmental cues important in the promotion of floral initiation. They also provide insights into apparently contradictory and inconsistent conclusions of published CO(2) enrichment studies in wheat.


Figures

Figure 1
Figure 1
Ratio of tiller dry weights under 350 ppm CO2 to tiller dry weights under 900 ppm CO2 at final harvest (d 23 and 27 in cv Birch and cv Hartog, respectively). Labels on the x axis refer to the main tiller (MS) followed by the five first primary tillers (T1–T5) and tillers of higher order grouped according to biological age (labels 5.1–8.1, corresponding to tillers that normally emerge concurrently with tiller T3–T7, respectively, and with leaves 6 to 9 on the main tiller, Masle [1984]). White bars, Ratios for non-vernalized plants; gray bars, ratios for vernalized plants.
Figure 2
Figure 2
Main tiller leaf area (top panel) and dry weight (bottom panel) plotted as a function of time (days from sowing) for the non-vernalized seedlings of cv Birch and cv Hartog grown under 350 (○) and 900 ppm [CO2] (●); bars across symbols represent 2 se. Note that the y axis is common to the two genotypes and is in log-scale.
Figure 3
Figure 3
Soluble sugar contents (mg g−1 dry weight; means ± se) measured on d 23 (cv Birch) or d 27 (cv Hartog) in the main tiller (ms), second primary tiller (T2), and in roots under 350 (white bars) and 900 ppm [CO2] (gray bars) in vernalized (left) and non-vernalized (right) seedlings. Glc, Fru, and Suc were measured individually but the two hexoses were present at very low concentrations (≤5 mg/g).
Figure 4
Figure 4
Comparison of blade elongation for successive leaves of the main tiller (leaf 2–8) under 350 (dashed line) and 900 ppm CO2 (solid line) in vernalized (left) and non-vernalized (right) seedlings of wheat cv Birch and cv Hartog. Blade length was measured from the ligule of the subtending leaf. Arrows on the x axis denote the times of first tiller emergence in low- and high-[CO2]-grown plants (thin and thick arrows, respectively).
Figure 5
Figure 5
Local cell partitioning rates (a) and relative elongation rates (b) averaged over successive cohorts of 20 cells along the growth zone under 350 and 900 ppm [CO2] (dashed and solid lines, respectively; vertical bars = 2 se). Data are for leaf 6 of vernalized cv Birch seedlings; [CO2] effects followed similar patterns in non-vernalized leaves and also in cv Hartog. On the x axis, positions along the growth zones are described by the distance from the distal end of the division zone, xsd.
Figure 6
Figure 6
Cell lengths (means and corresponding se) as a function of position along the growth zone in leaf 6 of vernalized (left) and non-vernalized (right) seedlings of cv Birch and cv Hartog grown under 350 (○) or 900 ppm CO2 (●). Cell lengths at the base of the growth zones (in the meristem and proximal end of the elongation-only zone) are shown in more detail in the insets. The curves were obtained by fitting the data using a Richards function, as described in “Materials and Methods.” Arrows on the x axis denote the position xel, where cell lengths were within 5% of mature cell length under 350 and 900 ppm CO2 (thin and thick arrows, respectively).
Figure 7
Figure 7
Relative elongation rates as a function of position along the “elongation-only” zone under 350 and 900 ppm CO2 (thin and thick lines, respectively). Curves were fitted to averages calculated over groups of 20 cells; bars denote the corresponding se values. Left, Vernalized seedlings; right, non-vernalized seedlings.
Figure 8
Figure 8
Densities of various epidermal cell types (no. of cells mm−2; means ± se) under 900 (y axis) and 350 ppm CO2 (x axis) in cv Birch (triangles) and cv Hartog (diamonds). Black symbols denote data for vernalized leaves, white symbols those for non-vernalized leaves. Labels denote cell types: tr, trichomes; st, stomatal complexes; sis, sister cells (cell row adjacent to the stomatal rows); el, elongated non-specialized epidermal cells.
Figure 9
Figure 9
Mesophyll cell cross-sectional area (top panel; means and se) and epidermal sister cells cross-sectional area (bottom panel) calculated as described in “Materials and Methods” in mature leaves grown under 350 (white bars) or 900 ppm CO2 (gray bars). Data (means and se) are shown for the two cultivars (left, cv Birch, and right, cv Hartog), and for vernalized and non-vernalized leaves (label v and nv on the x axis, respectively).
Figure 10
Figure 10
Decrease in blade thickness from the mid-rib to the edge of the blade. Measurements were taken on thin cross-sections across the mid-rib (MR) and the four adjacent veins (veins numbered 1–4 from MR) in mature leaves (leaf 6) grown under 350 or 900 ppm CO2 (white and black symbols, respectively). Bars across symbols denote se. The two rows of values above the x axis describe the extent of air spaces as a proportion of mesophyll tissue at the same locations (see “Materials and Methods”), with bold values (first row) referring to high-[CO2]-grown leaves and the values below referring to leaves grown under 350 ppm CO2. Boxed values are the averages across all positions. In the top right corner of each panel, average structural carbon contents (mol m−2) are given for high- and low-[CO2]-grown blades (in bold and normal characters, respectively). Left, Vernalized seedlings; right, non-vernalized seedlings.

References

    1. Ballard LAT, Wildman SG. Induction of mitosis by sucrose in excised and attached dormant buds of sunflower (Helianthus annuus L.) Aust J Biol Sci. 1964;17:36–43.
    1. Beemster GTS, Masle J, Williamson RE, Farquhar GD. Effects of soil resistance to root penetration on leaf expansion in wheat (Triticum aestivum L.): kinematic analysis of leaf elongation. J Exp Bot. 1996;47:1663–1678.
    1. Christ RA, Körner C. Responses of shoot and root gas exchange, leaf blade expansion and biomass production to pulses of elevated CO2 in hydroponic wheat. J Exp Bot. 1995;46:1661–1667.
    1. Downton WJ, Björkman O, Pike CS. Consequences of increased atmospheric concentrations of carbon dioxide for growth and photosynthesis of higher plants. In: Pearman GI, editor. Carbon Dioxide and Climate: Australian Research. Australian Academy of Science, Canberra. 1980. pp. 143–151.
    1. Erickson RO, Sax KB. Rates of cell division and cell elongation in the growth of the primary root of Zea mays. Proc Am Philos Soc. 1956;100:499–514.

LinkOut - more resources