. 2000 Apr;120(1):174-82.
doi: 10.1046/j.1365-2249.2000.01180.x.

Down-regulation of the T cell receptor CD3 zeta chain in rheumatoid arthritis (RA) and its influence on T cell responsiveness

Affiliations

Down-regulation of the T cell receptor CD3 zeta chain in rheumatoid arthritis (RA) and its influence on T cell responsiveness

L Berg et al. Clin Exp Immunol. 2000 Apr.

Abstract

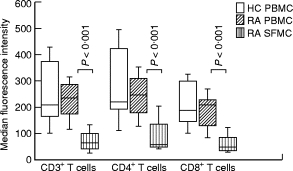
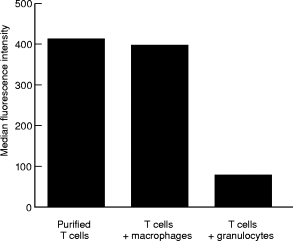
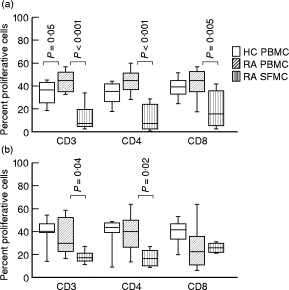
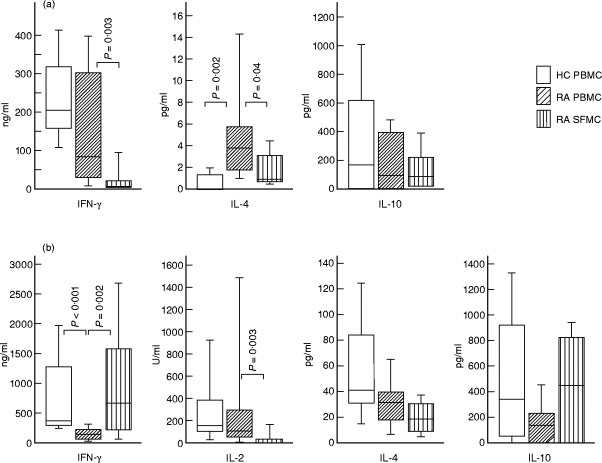
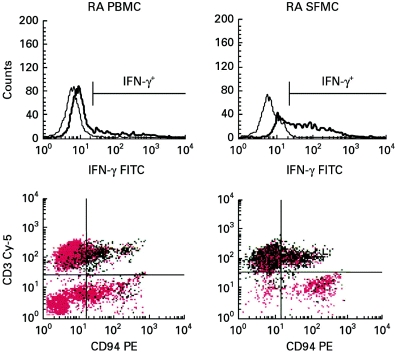
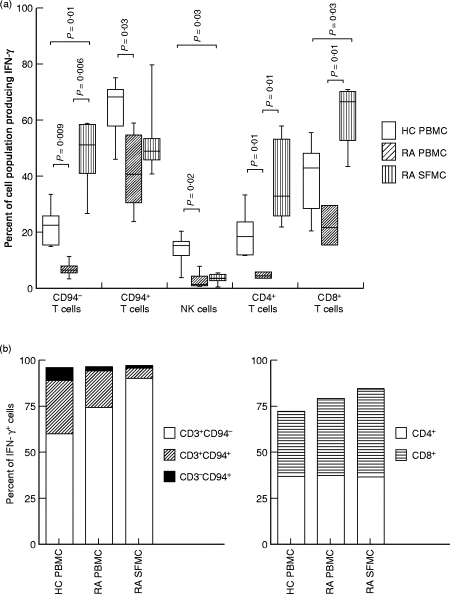
T cells implicated in chronic inflammatory diseases such as RA respond weakly when stimulated in vitro with mitogen or antigen. The mechanism behind this hyporesponsiveness is unclear, but a depressed expression of the T cell receptor (TCR)-associated CD3zeta chain has been suggested. In the present work we describe a low expression of CD3zeta in synovial fluid (SF) T cells from RA patients compared with peripheral blood (PB) T cells, but no difference in CD3zeta expression between RA and healthy control PB T cells. In vitro studies demonstrated that granulocytes but not SF macrophages are able to down-regulate the expression of CD3zeta. Through stimulation with anti-CD3 antibodies we demonstrated that the TCR-dependent proliferative response was decreased in SF T cells compared with PB T cells. Stimulation with phorbol ester and ionomycin also resulted in a low proliferative response of SF T cells, indicating that both signal transduction through the TCR (stimulation with anti-CD3) and events further downstream in the signalling pathways (stimulation with phorbol ester and ionomycin) are affected. A similar depression of T cell activity was observed when induction of IL-2 and IL-4 was measured. However, SF T cells were not defective in the induction of interferon-gamma (IFN-gamma) when stimulated with phorbol myristate acetate (PMA)/ionomycin, in contrast to the diminished IFN-gamma response observed after stimulation with anti-CD3. This indicates that the hyporesponsiveness of SF T cells can not be generalized to all T cell functions. The differential response to external stimuli is likely to be of importance for the capacity of SF T cells to influence inflammatory reactions.


Figures

Fig. 1
Fig. 1
Down-regulated CD3ζ expression in RA synovial fluid mononuclear cells (SFMC) but not in RA peripheral blood mononuclear cells (PBMC). Expression of CD3ζ was analysed by intracellular cytometric staining on density-separated PBMC and SFMC from 19 RA patients and PBMC from 16 healthy controls (HC). Median fluorescence intensity of CD3ζ staining was analysed in cells expressing CD3ε (defining all T cells), CD4 or CD8.
Fig. 2
Fig. 2
Down‐regulation of CD3ζ in T cells by granulocytes but not by macrophages. Purified RA peripheral blood (PB) T cells were coincubated with autologous synovial fluid (SF) macrophages or autologous SF granulocytes overnight and the T cell expression of CD3ζ was measured. One representative experiment of three is illustrated.
Fig. 3
Fig. 3
Defective proliferative response of RA synovial fluid (SF) T cells but not of RA peripheral blood (PB) T cells. Proliferation in response to (a) anti-CD3 stimulation and (b) phorbol 12-myristate 13-acetate (PMA)/ionomycin stimulation was measured by flow cytometric analysis of incorporated 5-bromo-2′-deoxyuridine (BrdU) in combination with cell surface staining of CD3ε, CD4 or CD8. The percentage of proliferating cells was compared between RA PB (n = 12) and healthy control (HC) PB (n = 10) and between RA PB and RA SF (n = 11), respectively.
Fig. 4
Fig. 4
Cytokine concentration in supernatants after stimulation of peripheral blood mononuclear cells (PBMC) or synovial fluid mononuclear cells (SFMC) with (a) anti-CD3 or (b) phorbol 12-myristate 13-acetate (PMA)/ionomycin. Cells were incubated for 24 h (IL-4) or 3 days (IFN-γ, IL-2 and IL-10) before collection of supernatants. Analyses were performed by cytokine-specific ELISAs. Comparisons were made between RA PBMC (n = 12) and healthy control (HC) PBMC (n = 10) or between RA PBMC and SFMC (n = 11), respectively. IL-2 secretion after CD3 stimulation could not be detected.
Fig. 5
Fig. 5
Flow cytometric analysis of IFN-γ-producing cells in RA peripheral blood mononuclear cells (PBMC) and synovial fluid mononuclear cells (SFMC). Cells were stimulated with or without phorbol 12-myristate 13-acetate (PMA)/ionomycin overnight in the presence of brefeldin A. Flow cytometry triple staining was performed by combining intracellular staining of IFN-γ with cell surface staining of CD3 and CD94. Thin and thick lines represent unstimulated and PMA/ionomycin-stimulated cells, respectively. Dot plots of gated IFN-γ+ (black) and IFN-γ (red) cells after stimulation with PMA/ionomycin are indicated below. One representative experiment of five is illustrated.
Fig. 6
Fig. 6
Identification of IFN-γ-producing cells after phorbol 12-myristate 13-acetate (PMA)/ionomycin stimulation. RA peripheral blood mononuclear cells (PBMC; n = 5), synovial fluid mononuclear cells (SFMC; n = 6) and healthy control (HC) PBMC (n = 5) were stimulated with PMA/ionomycin overnight in the presence of brefeldin A. Intracellular staining of IFN-γ combined with surface staining of either CD3 and CD94 or CD4 and CD8 was performed. (a) Proportion of IFN-γ-expressing cells in different subsets of T cells and natural killer (NK) cells. Gates were set for T cells (CD3+CD94, CD3+CD94+, CD4+ or CD8+) and NK cells (CD3CD94+), and the percentage of IFN-γ+ cells within each cell population was calculated. (b) Gates were set for IFN-γ+ cells and the distribution of the cytokine-expressing cells among T cells (CD3+CD94, CD3+CD94+, CD4+ or CD8+) and NK cells (CD3CD94+) was calculated (median values).

Similar articles

Cited by

References

    1. Kiessling R, Kono K, Petersson M, et al. Immunosuppression in human tumor–host interaction. Role of cytokines and alterations in signal-transducing molecules. Springer Semin Immunopathol. 1996;18:227–42. - PubMed
    1. Finke JH, Zea AH, Stanley J, et al. Loss of T-cell receptor zeta chain and p56lck in T-cells infiltrating human renal cell carcinoma. Cancer Res. 1993;53:5613–6. - PubMed
    1. Nakagomi H, Petersson M, Magnusson I, et al. Decreased expression of the signal-transducing zeta chains in tumor-infiltrating T-cells and NK cells of patients with colorectal carcinoma. Cancer Res. 1993;53:5610–2. - PubMed
    1. Gunji Y, Hori S, Aoe T, et al. High frequency of cancer patients with abnormal assembly of the T cell receptor–CD3 complex in peripheral blood T lymphocytes. Jap J Cancer Res. 1994;85:1189–92. - PMC - PubMed
    1. Zea AH, Curti BD, Longo DL, et al. Alterations in T cell receptor and signal transduction molecules in melanoma patients. Clin Cancer Res. 1995;1:1327–35. - PubMed

Publication types

MeSH terms