. 2000 Apr 11;97(8):3890-5.
doi: 10.1073/pnas.97.8.3890.

Effects of saturation mutagenesis of the phage SP6 promoter on transcription activity, presented by activity logos

Affiliations

Effects of saturation mutagenesis of the phage SP6 promoter on transcription activity, presented by activity logos

I Shin et al. Proc Natl Acad Sci U S A. .

Abstract

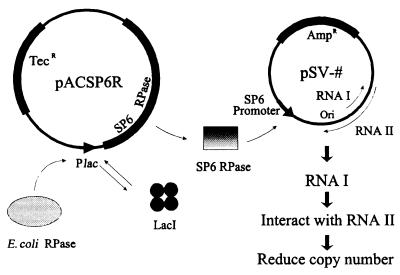
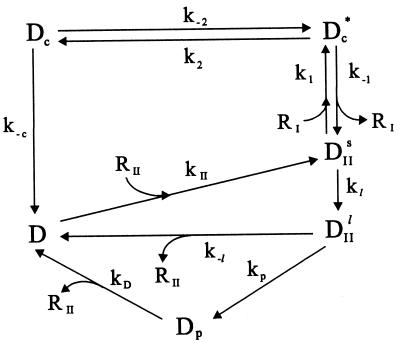
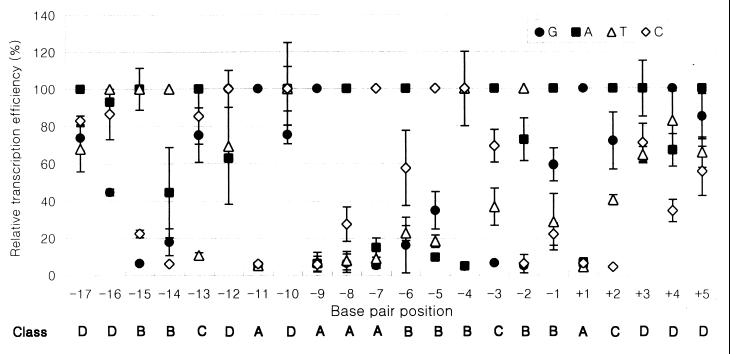
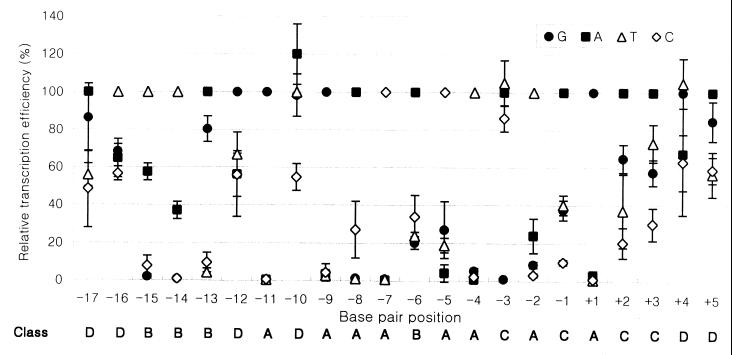
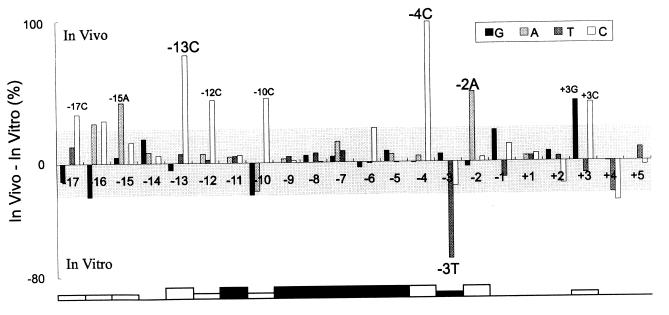
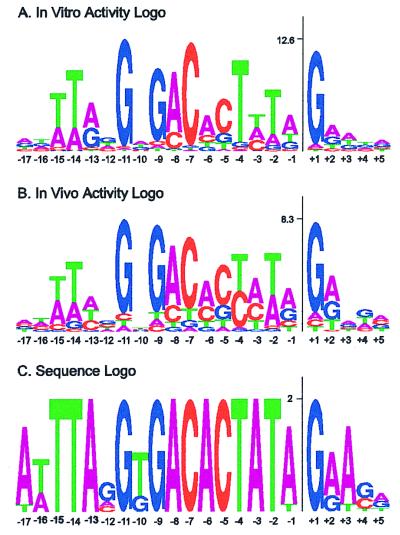
A full set of SP6 promoter variants with all possible single substitutions at positions -17 to +5 was constructed. Transcription activities of these variants were individually measured in vivo and in vitro to determine the contribution of each base pair to the promoter activity. The in vivo activity was measured indirectly by transcriptional interference of the replication of promoter-bearing plasmids. This activity depends most highly on residues -11, -9, -8, -7, and +1 (initiation site). All substitutions at -11, -9, -8, and -7 abolished formation of closed complexes, except for A-8C. These residues are involved in base-specific interactions with the polymerase, and the substitutions exhibit the same strong inhibition in vitro. In contrast, the in vitro activities of some other variants, measured on linearized templates, were different from those in vivo. Some variants at -13, -4, and -2, among others, showed exceptionally higher activities in vivo than in vitro, supporting the possibility that these residues are involved in postbinding steps, including template melting and bending. The A-3T variant showed much lower activity in vivo than in vitro, but it bound to the polymerase 2-fold more than the consensus sequence and is possibly involved in polymerase binding. A quantitative hierarchy of all the base pairs is graphically displayed by activity logos, revealing the energetic contribution of each base pair to the activity.


Figures

Figure 1
Figure 1
In vivo transcription assay based on interference of the replication of pSV-no. plasmids by SP6 transcription. SP6 RNA polymerase is produced from the gene under the control of the lac promoter in plasmid pACSP6R. It recognizes an SP6 promoter variant on a pSV-no. plasmid and produces a transcript that contains a 3′ RNA I sequence. This RNA interacts with RNA II and reduces the pSV-no. copy number. Thus, the copy number depends on strength of the promoter variant.
Figure 2
Figure 2
Kinetic scheme of the ColE1 replication control mechanism slightly modified from the model of Brendel and Perelson (20). The parent plasmid of pSV-no., pGEM4Z, does not produce the Rom protein. The values of parameters k1, k−1, and k2 were modified to 4.2 × 10⁷ M−1⋅min−1, 202 min−1, and 16.5 min−1, respectively, to fix the copy number of pGEM4Z at 400 per cell. Other parameters are the same as described (20). Plasmid DNA occurs either free (D) or in association with RNA II transcripts (DIIs for short transcripts or DIIl for longer transcripts), with RNA II primer (Dp), or with bound complex (Dc* and Dc). Short-length plasmid-bound RNA II (DIIs) forms an unstable complex with RNA I (Dc*). Replication converts primed DNA (Dp) to free DNA (D). The conversions between the different states occur at the rates indicated.
Figure 3
Figure 3
Relative in vivo transcription efficiencies of SP6 promoter variants compared with the consensus SP6 promoter. Each position was classified as described in the text, and the classifications (classes A to D) are shown at the bottom. An average of more than three measurements was taken for each variant.
Figure 4
Figure 4
Relative in vitro transcription efficiencies of SP6 promoter variants compared with consensus SP6 promoter. Each position was classified as described in the text, and the classifications (classes A to D) are shown at the bottom. An average of more than three measurements was taken for each variant.
Figure 5
Figure 5
Difference between in vivo and in vitro activities of the promoter variants. Each bar results from subtracting the in vitro activity from the in vivo activity, separately expressed as the percentage of the consensus promoter activity. Differences shown in the shaded area are within experimental error. Residues possibly involved in polymerase binding (filled boxes) and those displaying high in vivo:in vitro activity ratios (open boxes) are highlighted at the bottom.
Figure 6
Figure 6
Activity and sequence logos of the phage SP6 promoter. The two activity logos were constructed based on energetic contribution of each base pair in every position to the promoter activity as described in the text. Maximum heights of the activity logos simply reflect lower limits of measurements. The maximum information content in each residue is 2 in sequence logos. The sequence logos were generated from 11 known SP6 promoter sequences (1) by http://www.bio.cam.ac.uk/seqlogo/logo.cgi (15).

References

    1. Lee S S, Kang C. J Biol Chem. 1992;268:19299–19304. - PubMed
    1. Chapman K A, Burgess R R. Nucleic Acids Res. 1987;15:5413–5432. - PMC - PubMed
    1. Chapman K A, Gunderson S I, Anello M, Wells R D, Burgess R R. Nucleic Acids Res. 1988;16:4511–4524. - PMC - PubMed
    1. Schneider T D, Stormo G D. Nucleic Acids Res. 1989;17:659–674. - PMC - PubMed
    1. Ikeda R A, Ligman C M, Warshamana S. Nucleic Acids Res. 1992;20:2517–2524. - PMC - PubMed

Publication types

LinkOut - more resources