. 2000 Apr 11;97(8):4112-7.
doi: 10.1073/pnas.97.8.4112.

Compositional genomes: prebiotic information transfer in mutually catalytic noncovalent assemblies

Affiliations

Compositional genomes: prebiotic information transfer in mutually catalytic noncovalent assemblies

D Segré et al. Proc Natl Acad Sci U S A. .

Abstract

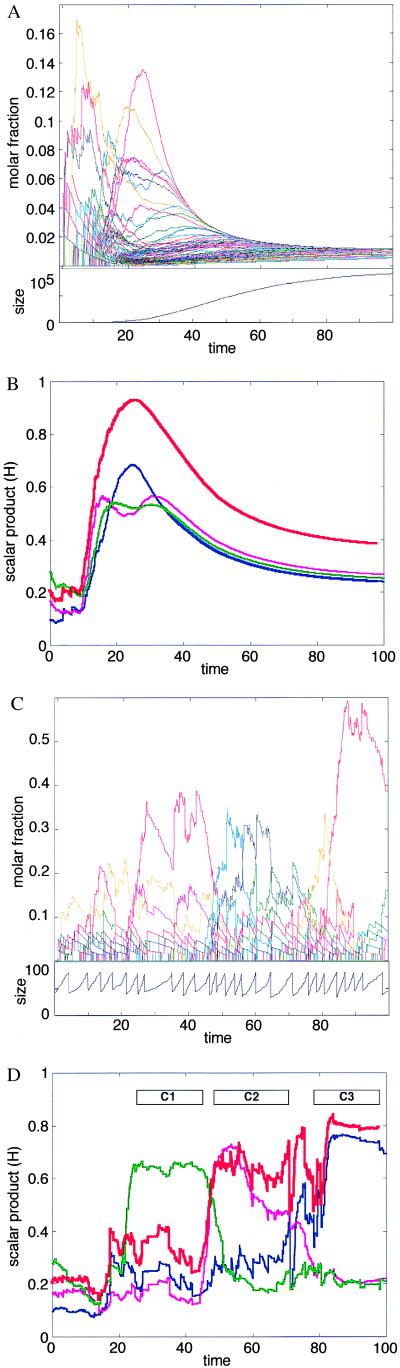
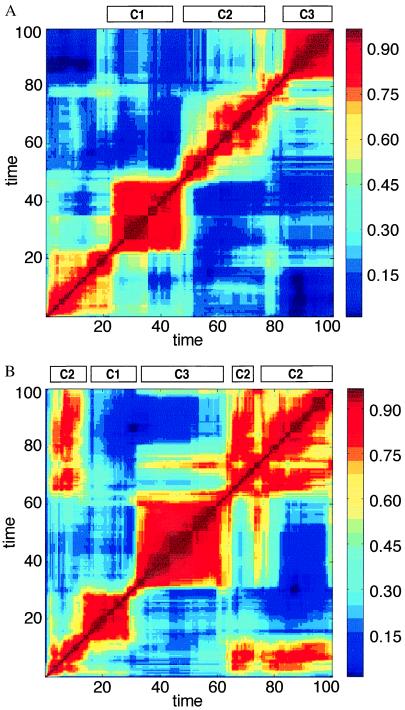
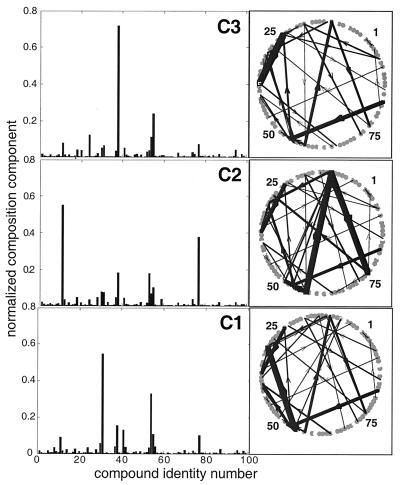
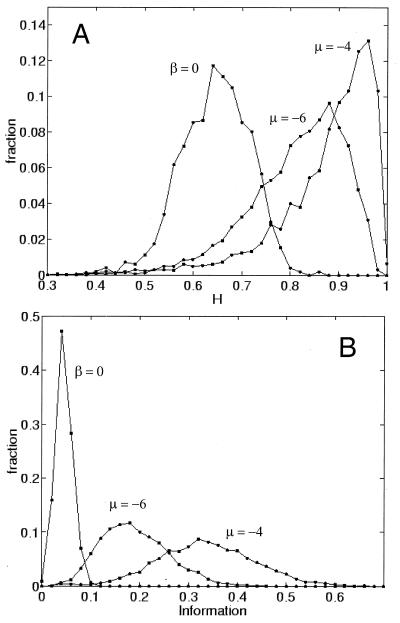
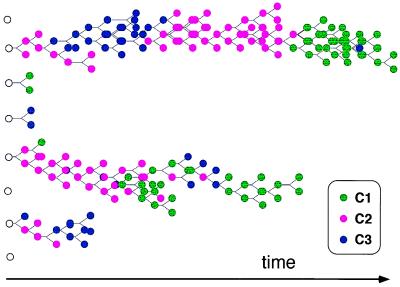
Mutually catalytic sets of simple organic molecules have been suggested to be capable of self-replication and rudimentary chemical evolution. Previous models for the behavior of such sets have analyzed the global properties of short biopolymer ensembles by using graph theory and a mean field approach. In parallel, experimental studies with the autocatalytic formation of amphiphilic assemblies (e.g., lipid vesicles or micelles) demonstrated self-replication properties resembling those of living cells. Combining these approaches, we analyze here the kinetic behavior of small heterogeneous assemblies of spontaneously aggregating molecules, of the type that could form readily under prebiotic conditions. A statistical formalism for mutual rate enhancement is used to numerically simulate the detailed chemical kinetics within such assemblies. We demonstrate that a straightforward set of assumptions about kinetically enhanced recruitment of simple amphiphilic molecules, as well as about the spontaneous growth and splitting of assemblies, results in a complex population behavior. The assemblies manifest a significant degree of homeostasis, resembling the previously predicted quasi-stationary states of biopolymer ensembles (Dyson, F. J. (1982) J. Mol. Evol. 18, 344-350). Such emergent catalysis-driven, compositionally biased entities may be viewed as having rudimentary "compositional genomes." Our analysis addresses the question of how mutually catalytic metabolic networks, devoid of sequence-based biopolymers, could exhibit transfer of chemical information and might undergo selection and evolution. This computed behavior may constitute a demonstration of natural selection in populations of molecules without genetic apparatus, suggesting a pathway from random molecular assemblies to a minimal protocell.


Figures

Figure 1
Figure 1
Results of computer simulations for the kinetics of spontaneous aggregation in amphiphilic assemblies. An initial assembly was seeded randomly by choosing Nmin individual molecules out of a pool containing nTOT molecules of each of NG possible types. Here NG = 100, nTOT = 1,000, Nmin = 40. A Monte Carlo type method was used for performing discrete stochastic changes in the assembly, as dictated by Eq. 4, and by using methods as described (68). At each time step, the change in the count of molecules of each species (Δni) was calculated by random sampling from a Poisson distribution with average Fi(nt, where Δt defines the time scale of the process. In the results presented here Δt = 0.05 sec. The logarithms of the rate enhancement factors βij were sampled from a normal distribution [used as a continuous approximation for the binomial distribution (57)] with an average μ = −4 and a SD σ = 4. These numerical parameter values were selected so that the resultant rate enhancement would conform with an experimentally based distribution derived from multiple reported data sets for lipid micelle catalysis (52). The molar fractions of free molecules of kind i is defined as ρi = (nTOTni)/NG. For the forward and backward reaction rates we use the values kf = 10-2 and kb = 10-5 sec-1 (for simplicity, all molecules are assumed to have identical uncatalyzed rate constants, and to differ only in their mutual rate enhancement properties). The program was written for matlab, version 5 (Mathworks, Natick, MA). The detailed results of the computer simulations are available on line at http://ool.weizmann.ac.il/PNAS2000. (A) The time dependence of the molar fraction ni/N for each species i, in an assembly whose growth is limited only by the finite supply of molecules (Upper). Because all of the species are thermodynamically equivalent, they reach the same molar fraction after a certain time. In the transient the random network of mutual rate enhancements determines significant and nontrivial differences among the various molecular types. The change of assembly size N with time is shown (Lower): the initial increase is nearly exponential, leveling off to zero growth as the external molecular supply is exhausted and equilibrium is reached. (B) The change of the similarity values H (Eq. 2) with time. The red line depicts H values relative to the asymptotic composition n* reached by an assembly that forms and expands indefinitely with unlimited supply of all molecular species ni. n* represents the asymptotic steady-state solution of Eq. 4. The three thin lines measure the similarity to the three main composomes of Fig. 3. (C) The time-dependent behavior of a system similar to that in A and B, but with an added process of splitting the assembly when its size reaches 2Nmin. The splitting is performed by randomly dividing such an assembly into two daughter assemblies of size ≈Nmin each. The count of each molecular species in a daughter assembly is sampled from a binomial distribution with ni trials and probability 0.5. In addition, a constant population condition (11) is implemented by decomposing one randomly selected assembly after each splitting event. This is done by breaking the chosen assembly into its monomeric constituents and replenishing the external species concentrations ρi. The change of assembly size N with time, indicating the periodical splits, is shown (Lower). (D) The analysis of H relative to specific compositions for the same simulation shown in C. The initial random assembly proceeds through relatively abrupt transitions from one composome to another. Composomes are marked as C1 (green), C2 (magenta), and C3 (blue) (see Fig. 3).
Figure 2
Figure 2
A time correlation matrix for H values (Eq. 2), where the ordinate and the abscissa represent np and nq, compositional vectors at different points in the time-dependent evolution of a particular assembly. In this case H for nearly disposed time steps assumes the meaning of degree of homeostasis. Red colors signify higher H value (bar on right). (A) The H matrix for the run shown in Fig. 1 C and D. The four main red squares around the diagonal signify time intervals in which the composition does not undergo major changes (QSSs). The bars labeled C1, C2, and C3 are defined by the maximal similarity between the composition at a given time point and one of the three major composomes of Fig. 3. Intercomposome dissimilarity is displayed as blue off-diagonal areas (low H values). A statistical analysis of the lifetimes of different composomes revealed an exponential distribution, probably related to the Poissonian nature of the mutation-like compositional changes. In computer simulation that encompass 20,000 growth and split steps, the following prevalences were observed: C1, 0.13; C2, 0.37; C3, 0.50. (B) The influence of different initial conditions is seen in a different run with the same kinetic parameters but with a different initial composition. The H matrix displays off-diagonal red rectangles, representing compositions that emerge more than once.
Figure 3
Figure 3
The compositions and “metabolic” networks for the three composomes of the previous figures. A fuzzy c-means clustering algorithm of matlab was applied to a data set of 1,000 compositions sampled immediately after split events. (Left) Histograms represent normalized molar fractions at the cluster centers. (Right) The respective “metabolic” networks, where the width of each arrow represents the effective strength of the catalytic enhancement, calculated as nj⋅βij (arrows with nj⋅βij<20 are omitted).
Figure 4
Figure 4
Probability distributions for assembly characteristics as a function of the degree of mutual rate enhancement. β = 0 indicates no catalysis; medium and high catalysis (μ = −6 and μ = −4, respectively) represent β matrices sampled from normal distributions of the rate enhancement factors with the indicated mean and a SD of 4 (see legend to Fig. 1). Each distribution is computed for 4,000 assemblies, and values are sampled immediately after split events. (A) The homeostasis parameter H computed for pairs of parent and progeny. As the mutual rate enhancement is increased, H values shift form 0.65 ± 0.07, corresponding to random similarity values, through 0.81 ± 0.10 for low catalysis and 0.88 ± 0.10 for high catalysis, showing that the denser catalytic networks also are characterized by a higher level of average homeostasis. This finding indicates that a larger fraction of the assemblies tend to transmit their unique composition to their progeny. (B) The information or compositional bias parameter I. When there is no catalysis, I assumes very low values (0.05 ± 0.02), corresponding to low-information assemblies near thermodynamic equilibrium. The introduction of mutual rate enhancement leads to an appreciable increase in the information content to 0.19 ± 0.07 (μ = −6) and 0.34 ± 0.10 (μ = −4) (the maximal value of I is 1).
Figure 5
Figure 5
An evolutionary tree for a population of assemblies. The total number of assemblies is kept constant at a population size W = 8. The color coding is according to the three clusters presented in Fig. 3, as indicated in the Inset. Open circles represent the random initial compositions used to seed the population. The length of the lines from a parent assembly to its progeny is proportional to the time taken to reach splitting size. Circles without progeny depict assemblies that were destroyed. The simulation parameters and the time scale are as in Fig. 1.

References

    1. Miller S L. Science. 1953;117:528–529. - PubMed
    1. Hargreaves W R, Mulvihill S, Deamer D W. Nature (London) 1977;266:78–80. - PubMed
    1. Rao M, Eichenberg J, Oró J. J Mol Evol. 1982;18:196–202. - PubMed
    1. Dyson F. Origins of Life. Cambridge: Cambridge Univ. Press; 1999.
    1. Lifson S, Lifson H. J Theor Biol. 1999;199:425–433. - PubMed

Publication types

LinkOut - more resources