Comparison of myocardial contrast echocardiography with NC100100 and (99m)Tc sestamibi SPECT for detection of resting myocardial perfusion abnormalities in patients with previous myocardial infarction
- PMID: 10768900
- PMCID: PMC1760845
- DOI: 10.1136/heart.83.5.518
Comparison of myocardial contrast echocardiography with NC100100 and (99m)Tc sestamibi SPECT for detection of resting myocardial perfusion abnormalities in patients with previous myocardial infarction
Abstract
Objective: To determine whether myocardial contrast echocardiography (MCE) following intravenous injection of perfluorocarbon microbubbles permits identification of resting myocardial perfusion abnormalities in patients who have had a previous myocardial infarction.
Patients and interventions: 22 patients (mean (SD) age 66 (11) years) underwent MCE after intravenous injection of NC100100, a novel perfluorocarbon containing contrast agent, and resting (99m)Tc sestamibi single photon emission computed tomography (SPECT). With both methods, myocardial perfusion was graded semiquantitatively as 1 = normal, 0.5 = mild defect, and 0 = severe defect.
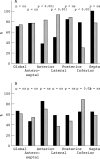
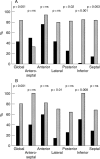
Results: Among the 203 normally contracting segments, 151 (74%) were normally perfused by SPECT and 145 (71%) by MCE. With SPECT, abnormal tracer uptake was mainly found among normally contracting segments from the inferior wall. By contrast, with MCE poor myocardial opacification was noted essentially among the normally contracting segments from the anterior and lateral walls. Of the 142 dysfunctional segments, 87 (61%) showed perfusion defects by SPECT, and 94 (66%) by MCE. With both methods, perfusion abnormalities were seen more frequently among akinetic than hypokinetic segments. MCE correctly identified 81/139 segments that exhibited a perfusion defect by SPECT (58%), and 135/206 segments that were normally perfused by SPECT (66%). Exclusion of segments with attenuation artefacts (defined as abnormal myocardial opacification or sestamibi uptake but normal contraction) by either MCE or SPECT improved both the sensitivity (76%) and the specificity (83%) of the detection of SPECT perfusion defects by MCE.
Conclusions: The data suggest that MCE allows identification of myocardial perfusion abnormalities in patients who have had a previous myocardial infarction, provided that regional wall motion is simultaneously taken into account.
Figures


Similar articles
-
Accuracy and feasibility of contrast echocardiography for detection of perfusion defects in routine practice: comparison with wall motion and technetium-99m sestamibi single-photon emission computed tomography. The Nycomed NC100100 Investigators.J Am Coll Cardiol. 1998 Nov;32(5):1260-9. doi: 10.1016/s0735-1097(98)00373-8. J Am Coll Cardiol. 1998. PMID: 9809934 Clinical Trial.
-
NC100100, a new echo contrast agent for the assessment of myocardial perfusion--safety and comparison with technetium-99m sestamibi single-photon emission computed tomography in a randomized multicenter study.Clin Cardiol. 1999 Apr;22(4):273-82. doi: 10.1002/clc.4960220405. Clin Cardiol. 1999. PMID: 10198737 Free PMC article. Clinical Trial.
-
Myocardial contrast echocardiography in human beings: correlation of resting perfusion defects to sestamibi single photon emission computed tomography.Am Heart J. 1996 Sep;132(3):528-35. doi: 10.1016/s0002-8703(96)90234-3. Am Heart J. 1996. PMID: 8800021
-
Assessment of myocardial viability by myocardial contrast echocardiography: current perspectives.Curr Opin Cardiol. 2019 Sep;34(5):495-501. doi: 10.1097/HCO.0000000000000650. Curr Opin Cardiol. 2019. PMID: 31313697 Review.
-
Microvascular function in Takotsubo cardiomyopathy with contrast echocardiography: prospective evaluation and review of literature.J Am Soc Echocardiogr. 2009 Nov;22(11):1249-55. doi: 10.1016/j.echo.2009.07.012. Epub 2009 Sep 18. J Am Soc Echocardiogr. 2009. PMID: 19766449 Review.
Cited by
-
Assessment of infarcted myocardium with real time myocardial contrast echocardiography: comparison with technetium-99m sestamibi single photon emission computed tomography.Heart. 2005 Dec;91(12):1568-72. doi: 10.1136/hrt.2004.057844. Epub 2005 Mar 17. Heart. 2005. PMID: 15774606 Free PMC article.
-
Cardiac imaging in coronary artery disease: differing modalities.Heart. 2005 Aug;91(8):1110-7. doi: 10.1136/hrt.2005.061408. Heart. 2005. PMID: 16020614 Free PMC article. Review. No abstract available.
References
Publication types
MeSH terms
Substances
LinkOut - more resources
Full Text Sources
Medical
