. 2000 Apr 17;149(2):317-30.
doi: 10.1083/jcb.149.2.317.

The respective contributions of the mother and daughter centrioles to centrosome activity and behavior in vertebrate cells

Affiliations

The respective contributions of the mother and daughter centrioles to centrosome activity and behavior in vertebrate cells

M Piel et al. J Cell Biol. .

Abstract

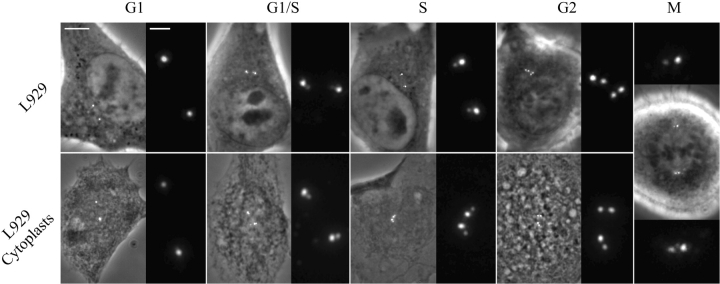
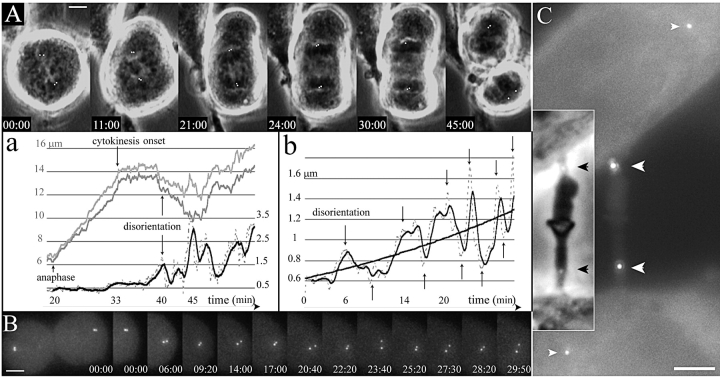
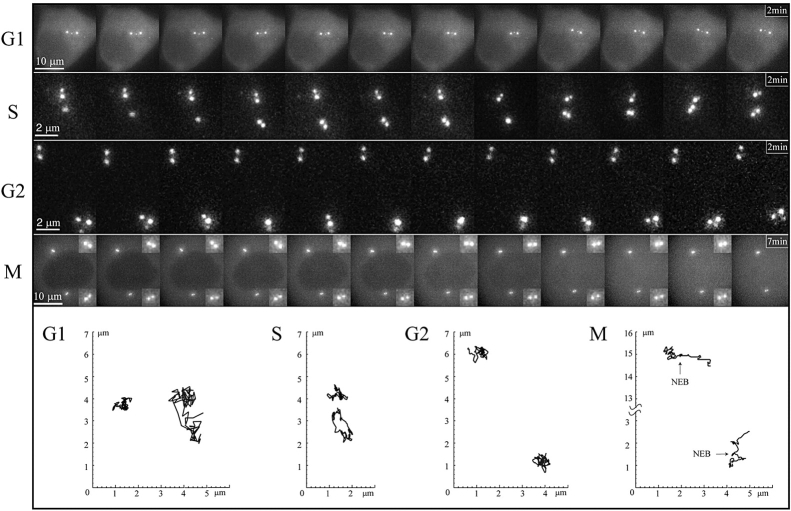
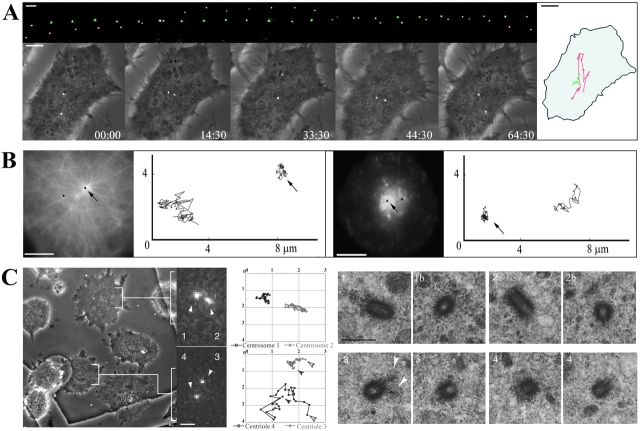
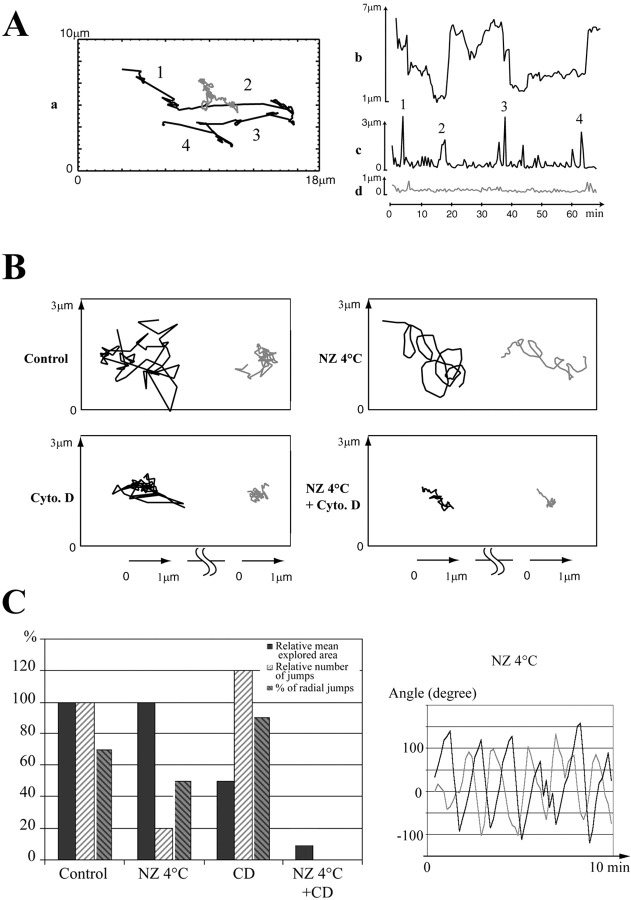
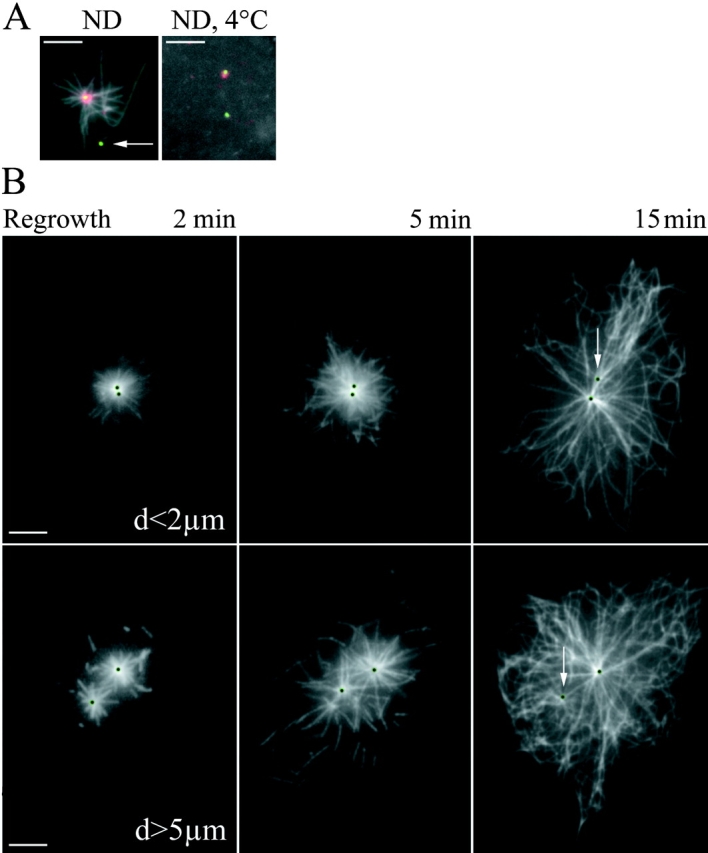
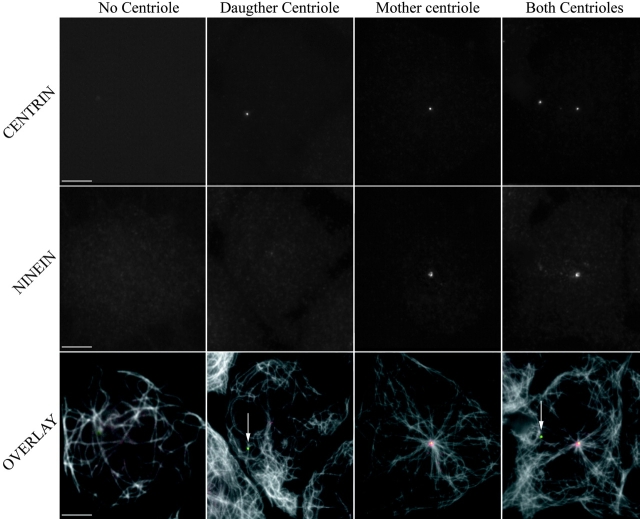
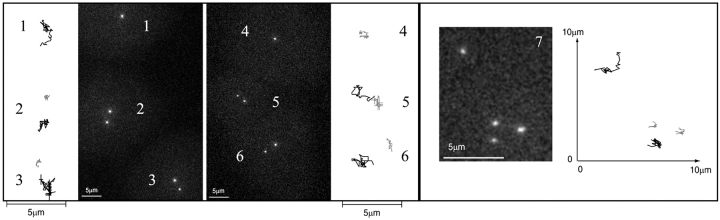
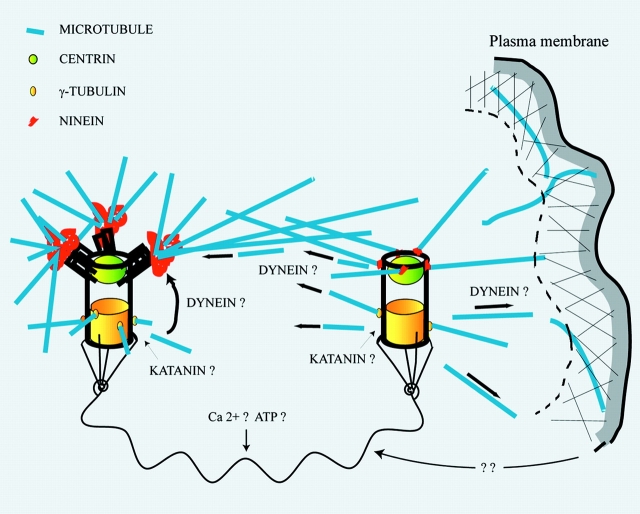
We have generated several stable cell lines expressing GFP-labeled centrin. This fusion protein becomes concentrated in the lumen of both centrioles, making them clearly visible in the living cell. Time-lapse fluorescence microscopy reveals that the centriole pair inherited after mitosis splits during or just after telophase. At this time the mother centriole remains near the cell center while the daughter migrates extensively throughout the cytoplasm. This differential behavior is not related to the presence of a nucleus because it is also observed in enucleated cells. The characteristic motions of the daughter centriole persist in the absence of microtubules (Mts). or actin, but are arrested when both Mts and actin filaments are disrupted. As the centrioles replicate at the G1/S transition the movements exhibited by the original daughter become progressively attenuated, and by the onset of mitosis its behavior is indistinguishable from that of the mother centriole. While both centrioles possess associated gamma-tubulin, and nucleate similar number of Mts in Mt repolymerization experiments. during G1 and S only the mother centriole is located at the focus of the Mt array. A model, based on differences in Mt anchoring and release by the mother and daughter centrioles, is proposed to explain these results.


Figures

Figure 1
Figure 1
Cell cycle changes in the distribution of centrin/GFP. Top row, L929 cells; bottom row, cytoplasts obtained from the same clone. For each period, the left picture is a superimposition of the GFP fluorescence and phase-contrast images, and the right picture is a 4× magnification of the GFP channel. Note that the distance between the two GFP dots in each diplosome increases from G1/S to S and G2. Bar, 5 μm for phase contrast images and 1 μm for higher magnification.
Figure 2
Figure 2
Centriole disorientation occurs early after the onset of cytokinesis. (A) Selected frames from a time-lapse recording of mitosis in HeLa cell progressing from metaphase to telophase. The top row shows selected phase contrast pictures with the GFP signal in white (centrioles signals were manually enhanced), whereas the behavior of the bottom centrosome during the complete recording is described on the corresponding graphics (a). The two upper curves (grey) are the distance of each centriole of the bottom centrosome to a fixed point at the center of the metaphase plate in the first frame (scale on the left). It mainly shows the increasing distance during anaphase and the differential movements of each centriole after cytokinesis onset. The lower curves are the distance between the two centrioles of the bottom centrosome (dotted line), and a mobile mean fit (black line; scale in μm on the right). It shows an almost constant distance (the little increase at 33 min is due to a rotation of the diplosome) until time 40 min after metaphase shown on the top left (20 min after anaphase) when it reaches a distance incompatible with a close association of the two centrioles. (B) One sister cell spreading after furrowing onset. Z-series were acquired every 10 s. The bottom row shows the GFP signal of the right sister cell at times corresponding to the arrows on the graph (b), showing the alternative splitting and joining of the centrioles. The curves in b are the distance between the two centrioles of the right centrosome (dotted line), and a mobile mean fit (black line). A logarithmic fit shows the globally increasing distance between both centrioles. (C) Two daughter cells still linked by a midbody in early G1. Two centrioles are located in the midbody (large white arrowheads) while the other two are far inside the cells (small white arrowheads). (Inset) The two black arrowheads show the location of the centrioles on the phase contrast picture of the midbody. Supplemental video is available at http://www.jcb.org/cgi/content/full/149/2/317/DC1. Bars, 5 μm.
Figure 3
Figure 3
(Top) Selected frames from time-lapse sequences depicting centriole behavior during the cell cycle. The G1, S and G2 sequences were recorded at 1 frame/2 s, and every 5th frame is shown here. The M series was recorded at 1 frame/5 s, and every 7th frame is shown here (insets show each diplosome at threefold magnification). (Bottom) Position plots depicting the trajectories of the centrioles shown above. One centriole remains stationary during all phases of the cell cycle while the other moves extensively during G1 and then gradually becomes sessile. Note that one of the two diplosomes (the bottom one in these images) exhibits rocking movements during S and G2. Supplemental video is available at http://www.jcb.org/cgi/content/full/149/2/317/DC1.
Figure 4
Figure 4
(A) Centriole behavior in G1 cytoplasts. The top row is of GFP images (at 6-min intervals) in which the nonmotile centriole was colored green while the motile one red. In the bottom row the GFP images are superimposed on phase-contrast images of the same cell (time = min/s). The diagram on the right represents the centrioles trajectories in relation to the cell boundaries. (B) The immotile centriole acts as the centrosome. G1 cytoplasts injected with rhodamine-tubulin (left panel) or having incorporated the B fragment of Shiga toxin coupled with Cyanin 3 (right panel) were video-recorded in two channels (GFP and rhodamine) during 10 min with a 4-s time-lapse. The pictures shown correspond to the first frame. The trajectories of the centrioles (in black on the pictures) are shown on the right. Arrows point to the immotile centriole. (C) The immotile centriole is the mother centriole. Movements of centrioles were recorded during 20 min, with 30-s time-lapse, in cytoplasts seeded on a gridded coverslip which were then flat embedded and processed for EM (see Materials and Methods). (Left) Phase contrast and GFP signals of the last frame. (Middle) Trajectories. The GFP signal appears pixelized because pictures were acquired at low resolution (63× objective and binning mode) in order to have at least 10 cells in a field. In these conditions, it was not possible to resolve the buds in duplicating centrioles at the optical level. (Right) High-voltage EM after semi-thick serial sectioning. The top row corresponds to the upper cytoplast and the bottom row to the lower cytoplast. The upper cytoplast contains two immotile GFP dots (1 and 2) which were revealed as two diplosomes by EM (1 and 1b, 2 and 2b). The lower cytoplast contains a motile (4) and an immotile (3) GFP dot, which corresponded to two centrioles. Two consecutive serial sections of each centriole are presented. The immotile centriole was identified as the mother centriole by the presence of appendages (white arrowheads). Supplemental video is available at http://www.jcb.org/cgi/content/full/149/2/317/DC1. Bars: (A and B) 5 μm; (C, GFP signal image) 2 μm; (C, phase contrast image) 8 μm.
Figure 5
Figure 5
Analysis of centriole movements in G1 cytoplasts. (A) Quantification of centrioles movements in the control G1 cytoplast shown in Fig. 4. (a) Corresponding trajectories; (b) distance between centrioles; (c and d) distances covered between two frames (30 s) by the daughter centriole (c) and the mother centriole (d). The numbers indicate periods of rapid movements of the daughter centriole. Between these periods the daughter centriole kept jolting while the mother centriole did not. (B) Drug effect on centrioles movements. The modifications of the trajectories induced by ND or CD are strikingly different, revealing that Mts and actin filaments drive two components of centrioles movements (see text). When both systems were impaired, centriole movements were minimal. (C, left) Quantification of the drug experiments on the movement of the daughter. Note that Mt disassembly reduced drastically the number of rapid movements (jumps) whereas impairing the actin system reduced the explored area. Note also that in CD-treated cytoplasts, movements of the daughter centriole are mostly radial with respect to the mother centriole. (Right) Correlation of mother and daughter centrioles movements in cytoplasts treated with ND. Each curve represents the angle variation over time between two consecutive segments of the trajectory of each centriole (dark line, motile centriole; grey line, immotile centriole). Note the phase shift between the two curves. Supplemental video is available at http://www. jcb.org/cgi/content/full/149/2/317/DC1.
Figure 6
Figure 6
γ-Tubulin associates with both centrioles, whereas ninein associates with the mother centriole only. G1 cytoplasts from cells expressing GFP-centrin were fixed and stained with anti–α-tubulin antibody or with either an anti–γ-tubulin or an anti-ninein antibody. Note that the ninein staining on the daughter centriole is very weak, whereas it is conspicuous and organized in several blobs, most often three, on the mother centriole. Note also on the bottom row the converging bundles of Mts abutting in the ninein blobs. On the top row, one can see that nonastral Mts are numerous in the vicinity of the daughter centriole. Bars: 5 μm or 2 μm for the bottom row and the top-right picture.
Figure 7
Figure 7
Stable Mts are anchored at the mother centriole and Mts are nucleated by both centrioles. (A, left) Cytoplasts treated during 10 min with 1 μM ND were fixed and stained with an anti–α-tubulin antibody (acquired in the blue channel and shown in grey), and an anti-ninein antibody (red). GFP-centrin signal is shown in green. Arrow points to the daughter centriole that does not anchor stable Mts. (Right) Cytoplasts treated during 40 min with 5 μM ND at 4°C do not contain Mts. Note that ninein is still associated with one centriole only. (B) Mt regrowth pattern depends upon the distance between both centrioles. After complete Mt depolymerization, the drug was washed and cytoplasts were fixed after 2, 5, or 15 min incubation at 37°C and stained with an anti–α-tubulin antibody. GFP signals are localized by black dots. White arrows indicate the daughter centriole, to which few Mts are associated at 15 min. (Top row) A typical Mt pattern observed in cytoplasts with two close centrioles. (Bottom row) Cytoplasts with distant centrioles. Note the released Mts at 5mn in the bottom row and the absence of peripheral Mts in the top row at 15 min. Bars, 5 μm.
Figure 8
Figure 8
Cytoplasts containing different centrosomes show different Mt organization. Cells were enucleated in the presence of ND in order to obtain cytoplasts with either no centriole, one centriole (daughter centriole or mother centriole), or two centrioles (see Materials and Methods). Mts were totally depolymerized. Cytoplasts were fixed after 15 min in regrowth conditions and stained for ninein (second row or red in the third row) and α-tubulin. GFP-centrin is shown on the first row. White arrows indicate the daughter centrioles. Bars, 5 μm.
Figure 9
Figure 9
G1 cytoplasts with variable numbers of centrioles. (Left) Two fields from two independent experiments are shown that both contain a cytoplast having only one centriole (1 and 4), and two cytoplasts having two centrioles (2, 3 and 5, 6). The trajectories video recorded during 10 min every 10 s are presented on each side. Cytoplast 1 contained a motile centriole while cytoplast 4 contained an immotile one. (Right) One G1 cytoplast (7) containing four centrioles (see Materials and Methods). The trajectories, recorded during 20 min every 30 s, show two motile and two immotile centrioles. The GFP pictures correspond to the first frame of each recording. Supplemental video is available at http://www.jcb.org/cgi/content/full/149/2/317/DC1.
Figure 10
Figure 10
A model for the role of each centriole in the centrosome. The model proposes that Mts are nucleated near centriole walls, then released and transported either to the ninein-containing complexes associated with the mother centriole or to other anchoring sites, mainly near or at the plasma membrane. An important feature of this model is that the intercentriolar distance, which might itself be dependent on peripheral acto-myosin activity, would regulate the release of Mts to the cell periphery. These Mts being then involved in peripheral processes, the control of the intercentriolar distance would provide a feed-back loop for the regulation of the cortical acto-myosin system. The link between both centrioles is probably composed of many different proteins usually found in the PCM, and its overall length could be calcium dependent. The maturation-dependent anchoring of the centrosome organelle in the cytoplasm is not represented.

References

    1. Ahmad F.J., Yu W., McNally F.J., Baas P.W. An essential role for katanin in severing Mts in the neuron. J. Cell Biol. 1999;145:305–315. - PMC - PubMed
    1. Andersen S.S.L. Molecular characteristics of the centrosome. Int. Rev. Cytol. 1999;187:51–109. - PubMed
    1. Baron A.T., Greenwood T.M., Bazinet C.W., Salisbury J.L. Centrin is a component of the pericentriolar lattice. Biol. Cell. 1992;76:383–388. - PubMed
    1. Baron A.T., Suman V.J., Nemeth E., Salisbury J.L. The pericentriolar lattice of PtK2 cells exhibits temperature and calcium-modulated behavior. J. Cell Sci. 1994;107:2993–3003. - PubMed
    1. Bobinnec Y., Khodjakov A., Mir L.M., Rieder C.L., Edde B., Bornens M. Centriole disassembly in vivo and its effect on centrosome structure and function in vertebrate cells. J. Cell Biol. 1998;143:1575–1589. - PMC - PubMed

Publication types

MeSH terms