. 2000 Apr;9(4):192-211.
doi: 10.1002/(sici)1097-0193(200004)9:4<192::aid-hbm2>3.0.co;2-y.

Lesion segmentation and manual warping to a reference brain: intra- and interobserver reliability

Affiliations

Lesion segmentation and manual warping to a reference brain: intra- and interobserver reliability

J A Fiez et al. Hum Brain Mapp. 2000 Apr.

Abstract

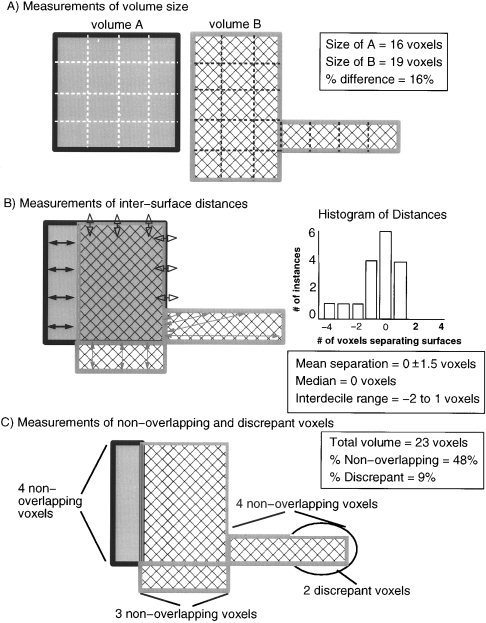
The study of subjects with acquired brain damage has been an invaluable tool for exploring human brain function, and the description of lesion locations within and across subjects is an important component of this method. Such descriptions usually involve the separation of lesioned from nonlesioned tissue (lesion segmentation) and the description of the lesion location in terms of a standard anatomical reference space (lesion warping). The objectives of this study were to determine the sources and magnitude of variability involved in lesion segmentation and warping using the MAP-3 approach. Each of two observers segmented the lesion volume in ten brain-damaged subjects twice, so as to permit pairwise comparisons of both intra- and interobserver agreement. The segmented volumes were then warped to a reference brain using both a manual (MAP-3) and an automated (AIR-3) technique. Observer agreement between segmented and warped volumes was analyzed using four measures: volume size, distance between the volume surfaces, percentage of nonoverlapping voxels, and percentage of highly discrepant voxels. The techniques for segmentation and warping produced high agreement within and between observers. For example, in most instances, the warped volume surfaces created by different observers were separated by less than 3 mm. The performance of the automated warping technique compared favorably to the manual technique in most subjects, although important exceptions were found. Overall, these results establish benchmark parameters for expert and automated lesion transfer, and indicate that a high degree of confidence can be placed in the detailed anatomical interpretation of focal brain damage based upon the MAP-3 technique.


Figures

Figure 1
Figure 1
Steps involved in creating a MAP‐3 transfer volume. First, the normal reference brain is examined to select an orientation and anterior‐posterior extent that corresponds to the orientation and the extent of the lesioned tissue in the damaged brain; this step can be appreciated graphically by comparing the tissue between the black lines on the 3D rendered lesioned brain (brain A) to those between the black lines on the reference brain (brain B). These parameters are used to reslice the normal reference brain to produce a series of coronal sections that have an orientation and slice thickness corresponding to the scan of the lesioned brain. This step can be appreciated by comparing the structural features of coronal sections from the lesioned brain (A) to those from the resliced reference brain (B). Third, the contour of the lesion on each slice is transferred onto the matched slices of the normal brain, taking into consideration anatomical landmarks; this step can be appreciated by comparing the lesion (darkened area in sections from brain A) to its transferred location in the reference brain (red area in sections from brain B). The traces transferred to the normal reference brain can be used to define an equivalent volume in the reference brain (illustrated by the red area across sections in B), and from its surface projection shown by the red volume in the rendered reference brain (brain B).
Figure 2
Figure 2
Steps involved in the AIR‐3 automated warping procedure. Parameters for the nonlinear warp were initialized by fitting images of the lesioned and reference brain to images of themselves in Talairach space [Talairach and Tournoux, 1988] space (1L and 1R). Then, using the outcome of 1L as initial conditions, the lesioned brain was fit to the image of the reference brain in Talairach space (2). The parameters for this fit were combined with the (inverted) parameters from 1R to derive the initial conditions for a nonlinear warp of the native space images of the lesioned brain to the native space images of the reference brain (3). These final warping parameters were used to transfer the binary image of the consensus lesion into the space of the reference brain.
Figure 3
Figure 3
Illustration of four metrics used to compare segmented and warped lesion volumes. (A) Volume sizes were compared by computing absolute percent differences in the number of voxels included in two different segmented or warped lesion volumes. (B) Differences in the location of volumes were evaluated by measuring the relative Euclidean distances between the nearest voxels on two volume surfaces. The values computed across the surface voxels of two volumes formed a set of values that was analyzed using descriptive statistics. (C) Differences in location were also analyzed by computing the percentages of nonoverlapping and highly discrepant voxels across the total volume encompassed by a pair of segmented or warped lesion volumes.
Figure 4
Figure 4
Comparison of lesion overlap map created from the ten volumes warped by JF using MAP‐3 (A), the ten volumes warped by HD using MAP‐3 (B), and the ten volumes warped using AIR‐3 (C). As shown qualitatively through the surface renderings and coronal sections, the lesion overlap maps are very similar (red = site of maximal lesion overlap, blue = site of minimal lesion overlap). This conclusion is supported quantitatively by pairwise subtractions of the lesion overlap volumes; as shown in the histograms (D), the typical difference in lesion overlap count across is zero, with an interdecile range of ± 1.
Figure 5
Figure 5
Illustration of intra‐ and interobserver variability in the segmentation of lesion boundaries. The lesion contours traced by two different observers are shown for two subjects [left panel shows a single coronal section from 0716 mg (one of the “discrepant” cases), right panel shows a single coronal section from 1492tk]. The top and middle rows illustrate intraobserver comparisons (top row: compare red line showing first trace by JF to blue line showing second trace by JF; middle row: compare red line showing first trace by HD to blue line showing second trace by HD). The bottom row illustrates interobserver comparisons (compare pink line showing first trace by JF to blue line showing first trace by HD). Sources of variability include minor discrepancies associated with interpreting the transition from lesioned to nonlesioned tissue and manually moving a cursor (A), and larger discrepancies caused by drawing along an imagined gyral edge (B), deciding whether a voxel represents damaged tissue vs. normal intersulcal space (C), or whether a voxel represents damaged tissue vs. an obliquely cut gyrus (D).
Figure 6
Figure 6
Illustration of a discrepancy in the transfer of lesion boundaries using MAP‐3 vs. AIR‐3. (A) 3D‐reconstructed brain of subject 1726ro after it was warped to the template brain. The blue area shows the lesion to be transferred to the normal brain. (B) The MAP‐3 warps by HD and JF are shown in green and red, with the area of overlap indicated in yellow. The warp produced by AIR‐3 is shown by the blue lines. The agreement between human observers is very good, but the agreement between methods (MAP‐3 vs. AIR‐3) is poor because the basal ganglia are damaged but AIR‐3 does not include them in the lesion.
Figure 7
Figure 7
Illustration of intraobserver variability in the transfer of lesion boundaries using MAP‐3. Comparisons between the transfer volumes for JF (shown in red on the coronal sections and leftmost 3D rendered brains) and HD (shown in blue on the coronal sections and rightmost 3D rendered brains) are shown for three subjects (top: 0468jg, middle: 0716 mg, bottom: 1198rs). Areas of overlap are shown in yellow. Most of the differences were minor (e.g., compare position of boundary edges in the second coronal section in each row). Larger discrepancies represent factors such as deciding whether the lesion extends into a new gyrus (e.g., compare the red vs. blue boundaries in the third section of the bottom row). The overall similarity in the transfer volumes is well illustrated by the similarities in location and extent on the 3D rendered brains.

References

    1. Bedell BJ, Narayana PA, Wolinsky JS. 1997. A dual approach for minimizing false lesion classifications on magnetic resonance images. Magn Reson Med 37: 94–102. - PubMed
    1. Bendszus M, Urbach H, Meyer B, Schultheiss R, Solymosi L. 1997. Improved CT diagnosis of acute middle cerebral artery territory infarcts with density‐difference analysis. Neuroradiology 39: 127–131. - PubMed
    1. Christensen GE, Joshi SC, Miller MI. 1997. Volumetric transformation of brain anatomy. IEEE Trans Med Imaging 16: 864–877. - PubMed
    1. Collins DL, Holmes CJ, Peters TM, Evans AE. 1995. Automatic 3‐D model‐based neuroanatomical segmentation. Hum Brain Mapp 3: 190–208.
    1. Damasio H, Damasio AR. 1980. The anatomical basis of conduction aphasia. Brain 103: 337–350. - PubMed

Publication types

LinkOut - more resources