. 2000 May;74(10):4839-52.
doi: 10.1128/jvi.74.10.4839-4852.2000.

A Rev-independent human immunodeficiency virus type 1 (HIV-1)-based vector that exploits a codon-optimized HIV-1 gag-pol gene

Affiliations

A Rev-independent human immunodeficiency virus type 1 (HIV-1)-based vector that exploits a codon-optimized HIV-1 gag-pol gene

E Kotsopoulou et al. J Virol. 2000 May.

Abstract

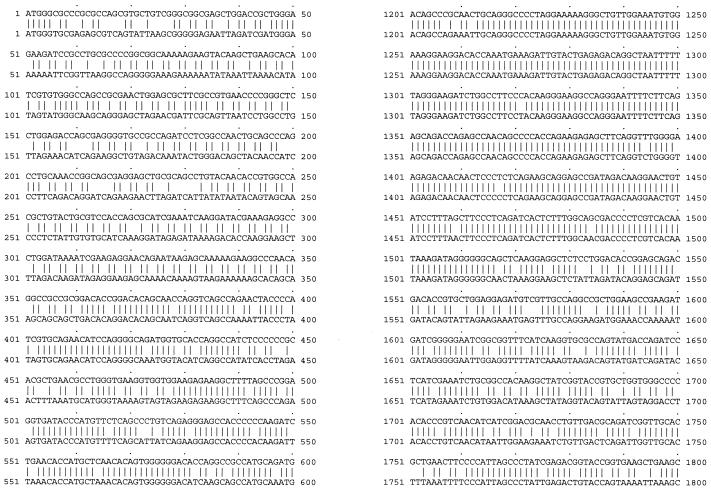
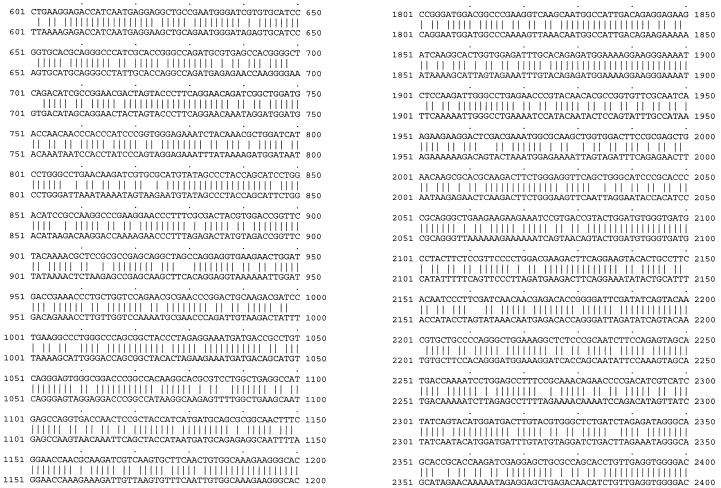
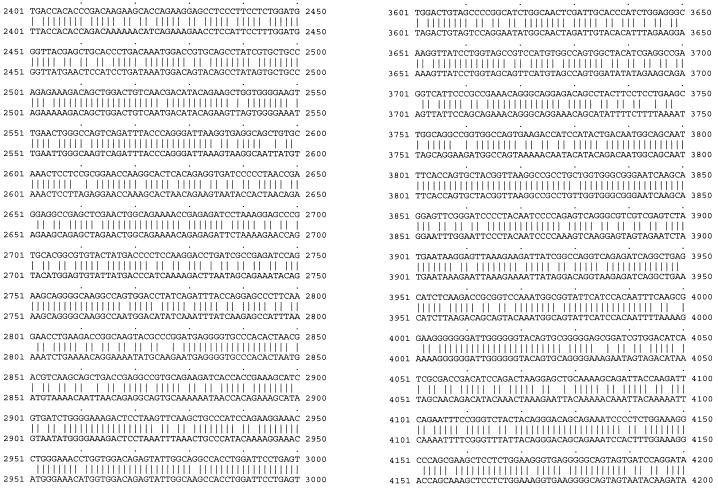
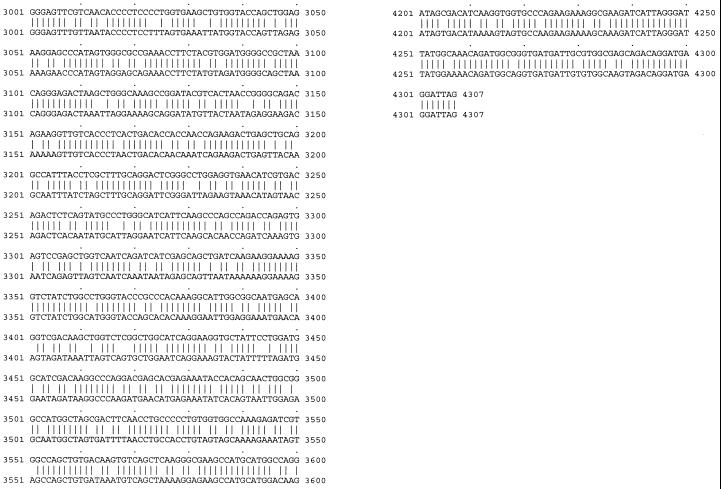
The human immunodeficiency virus (HIV) genome is AU rich, and this imparts a codon bias that is quite different from the one used by human genes. The codon usage is particularly marked for the gag, pol, and env genes. Interestingly, the expression of these genes is dependent on the presence of the Rev/Rev-responsive element (RRE) regulatory system, even in contexts other than the HIV genome. The Rev dependency has been explained in part by the presence of RNA instability sequences residing in these coding regions. The requirement for Rev also places a limitation on the development of HIV-based vectors, because of the requirement to provide an accessory factor. We have now synthesized a complete codon-optimized HIV-1 gag-pol gene. We show that expression levels are high and that expression is Rev independent. This effect is due to an increase in the amount of gag-pol mRNA. Provision of the RRE in cis did not lower protein or RNA levels or stimulate a Rev response. Furthermore we have used this synthetic gag-pol gene to produce HIV vectors that now lack all of the accessory proteins. These vectors should now be safer than murine leukemia virus-based vectors.


Figures

FIG. 1
FIG. 1
Sequence comparison between the wild-type HIV gag-pol sequence (pGP-RRE3; bottom) and the codon-optimized gag-pol sequence (pSYNGP; top).
FIG. 1
FIG. 1
Sequence comparison between the wild-type HIV gag-pol sequence (pGP-RRE3; bottom) and the codon-optimized gag-pol sequence (pSYNGP; top).
FIG. 1
FIG. 1
Sequence comparison between the wild-type HIV gag-pol sequence (pGP-RRE3; bottom) and the codon-optimized gag-pol sequence (pSYNGP; top).
FIG. 1
FIG. 1
Sequence comparison between the wild-type HIV gag-pol sequence (pGP-RRE3; bottom) and the codon-optimized gag-pol sequence (pSYNGP; top).
FIG. 2
FIG. 2
Protein expression and particle formation are high and Rev independent. The gag-pol expression plasmids (5 μg) were transfected into 293T cells in the presence or absence of Rev (pCMV-Rev; 1 μg), and protein levels were determined 48 h posttransfection in culture supernatants (A) and cell lysates (B). HIV-1-positive human serum was used to detect the Gag-Pol proteins. The blots were reprobed with an antiactin antibody, as an internal control (C). The protein marker (New England Biolabs) sizes (in kilodaltons) are at the left. Lanes: 1, mock-transfected 293T cells; 2, pGP-RRE3; 3, pGP-RRE3 plus pCMV-Rev; 4, pSYNGP; 5, pSYNGP plus pCMV-Rev; 6, pSYNGP-RRE; 7, pSYNGP-RRE plus pCMV-Rev; 8, pSYNGP-ERR; 9, pSYNGP-ERR plus pCMV-Rev.
FIG. 3
FIG. 3
Translation rates of the wild-type and codon-optimized genes. 293T cells were transfected with 2 μg of pGP-RRE3 (with or without pCMV-Rev [1 μg]) or 2 μg of pSYNGP. Protein samples from culture supernatants (A) and cell extracts (B) were analyzed by Western blotting 12, 25, 37, and 48 h posttransfection. HIV-1-positive human serum was used to detect Gag-Pol proteins (A and B), and an antiactin antibody was used as an internal control (C). The protein marker sizes (kilodaltons) at the left. A PhosphorImager was used for quantification of the results. Lanes: 1, pGP-RRE3 at 12 h; 2, pGP-RRE3 at 25 h; 3, pGP-RRE3 at 37 h; 4, pGP-RRE3 at 48 h; 5, pGP-RRE3 plus pCMV-Rev at 12 h; 6, pGP-RRE3 plus pCMV-Rev at 25 h; 7, pGP-RRE3 plus pCMV-Rev at 37 h; 8, pGP-RRE3 plus pCMV-Rev at 48 h; 9, pSYNGP at 12 h; 10, pSYNGP at 25 h; 11, pSYNGP at 37 h; 12, pSYNGP at 48 h; 13, mock-transfected 293T cells.
FIG. 4
FIG. 4
gag-pol mRNA levels in total and cytoplasmic fractions. Total and cytoplasmic RNA was extracted from 293T cells 36 h after transfection with 5 μg of the gag-pol expression plasmid (with or without pCMV-Rev [1 μg]), and mRNA levels were estimated by Northern blot analysis. A probe complementary to nt 1222 to 1503 of both the wild-type (Wt) and codon-optimized gene was used. (A) Band corresponding to HIV-1 gag-pol. The sizes of the mRNAs are 4.4 kb for the codon-optimized gene and 6 kb for the wild-type gene. (B) Band corresponding to human ubiquitin (internal control for normalization of results). Quantification was performed using a PhosphorImager. Lanes (c, cytoplasmic fraction; t, total RNA fraction): 1, pGP-RRE3; 2, pGP-RRE3 plus pCMV-Rev; 3, pSYNGP; 4, pSYNGP plus pCMV-Rev; 5, pSYNGP-RRE; 6, pSYNGP-RRE plus pCMV-Rev; 7, mock-transfected 293T cells; 8, pGP-RRE3 plus pCMV-Rev; 9, mock-transfected 293T cells; 10, pSYNGP.
FIG. 5
FIG. 5
Effect of the insertion of the wild-type gag sequence downstream of the codon-optimized gene on RNA and protein levels. The wild-type gag sequence was inserted downstream of the codon-optimized gene in both orientations (NotI site), resulting in plasmids pSYN6 (correct orientation; Fig. 6) and pSYN7 (reverse orientation; Fig. 6). The gene encoding β-Gal (lacZ) was also inserted in the same site and in the correct orientation (plasmid pSYN8; Fig. 6). 293T cells were transfected with 5 μg of each plasmid, and 48 h posttransfection mRNA and protein levels were determined as previously described by means of Northern and Western blot analyses, respectively. (A) Northern blot analysis of cytoplasmic RNA fractions. The blot was probed with a probe complementary to nt 1510 to 2290 of the codon-optimized gene (I) and was reprobed with a probe specific for human ubiquitin (II). Lanes: 1, pSYNGP; 2, pSYN8; 3, pSYN7; 4, pSYN6. (B) Western blot analysis. HIV-1-positive human serum was used to detect the Gag-Pol proteins (I), and an antiactin antibody was used as an internal control (II). Lanes with cell lysates: 1, mock-transfected 293T cells; 2, pGP-RRE3 plus pCMV-Rev; 3, pSYNGP; 4, pSYN6; 5, pSYN7; 6, pSYN8; lanes with supernatants: 7, mock-transfected 293T cells; 8, pGP-RRE3 plus pCMV-Rev; 9, pSYNGP; 10, pSYN6; 11, pSYN7; 12, pSYN8. The protein marker (New England Biolabs) sizes are at the left.
FIG. 6
FIG. 6
Plasmids used to study the effect of HIV-1 gag INS on the codon-optimized gene. The backbone for all constructs was pCI-Neo. Syn gp, codon-optimized HIV-1 gag-pol gene; HXB2 gag, wild-type HIV-1 gag gene. HXB2 gag,r, wild-type HIV-1 gag gene in the reverse orientation; HXB2 gag-ΔATG, wild-type HIV-1 gag gene without the gag ATG; HXB2 gag-fr.sh., wild-type HIV-1 gag gene with a frameshift mutation; HXB2 gag 625-1503, nt 625 to 1503 of the wild-type HIV-1 gag gene; HXB2 gag 1-625, nt 1 to 625 of the wild-type HIV-1 gag gene.
FIG. 7
FIG. 7
Insertion of HIV-1 gag upstream of the codon optimized gene affects cytoplasmic RNA levels. Cytoplasmic RNA was extracted 48 h after transfection of 293T cells (5 μg of each pSYN plasmid was used, and 1 μg of pCMV-Rev was cotransfected in some cases). The probe that was used was designed to be complementary to nt 1510 to 2290 of the codon-optimized gene (I). A probe specific for human ubiquitin was used as an internal control (II). (A) Lanes: 1, pSYNGP; 2, pSYN9; 3, pSYN10; 4, pSYN10 plus pCMV-Rev; 5, pSYN11; 6, pSYN11 plus pCMV-Rev; 7, pCMV-Rev. (B) Lanes: 1, pSYNGP; 2, pSYNGP-RRE; 3, pSYNGP-RRE plus pCMV-Rev; 4, pSYN12; 5, pSYN14; 6, pSYN14 plus pCMV-Rev; 7, pSYN13; 8, pSYN15; 9, pSYN17; 10, pGP-RRE3; 11, pSYN6; 12, pSYN9; 13, pCMV-Rev.
FIG. 8
FIG. 8
Nuclear export: the effect of LMB on protein production. 293T cells were transfected with 1 μg of pCMV-Rev and 3 μg of pGP-RRE3, pSYNGP, or pSYNGP-RRE (with or without pCMV-Rev [1 μg]). Transfections were done in duplicate. Five hours posttransfection the medium was replaced with fresh medium in the first set and with fresh medium containing 7.5 nM LMB in the second. Twenty hours later the cells were lysed and protein production was estimated by Western blot analysis. HIV-1-positive human serum was used to detect the Gag-Pol proteins (A), and an antiactin antibody was used as an internal control (B). Lanes: 1, pGP-RRE3; 2, pGP-RRE3 plus LMB; 3, pGP-RRE3 plus pCMV-Rev; 4, pGP-RRE3 plus pCMV-Rev plus LMB; 5, pSYNGP; 6, pSYNGP plus LMB; 7, pSYNGP plus pCMV-Rev; 8, pSYNGP plus pCMV-Rev plus LMB; 9, pSYNGP-RRE; 10, pSYNGP-RRE plus LMB; 11, pSYNGP-RRE plus pCMV-Rev; 12, pSYNGP-RRE plus pCMV-Rev plus LMB.
FIG. 9
FIG. 9
Cytoplasmic RNA levels of the vector genomes. 293T cells were transfected with 10 μg of each vector genome. Cytoplasmic RNA was extracted 48 h posttransfection, and 20 μg of RNA was used from each sample for Northern blot analysis. The 700-bp probe was designed to hybridize to all vector genome RNAs (see Materials and Methods). Lanes: 1, pH6nZ; 2, pH6nZ plus pCMV-Rev; 3, pH6.1nZ; 4, pH6.1nZ plus pCMV-Rev; 5, pHS1nZ; 6, pHS2nZ; 7, pHS3nZ; 8, pHS4nZ; 9, pHS5nZ; 10, pHS6nZ; 11, pHS7nZ; 12, pHS8nZ; 13, pCMV-Rev.
FIG. 10
FIG. 10
Transduction efficiency at an MOI of 1. Viral stocks were generated by cotransfection of each gag-pol expression plasmid (5 or 0.5 μg), 15 μg of pH6nZ or pHS3nZ (vector genome plasmid), and 5 μg of pHCMVG (VSV envelope expression plasmid) on 293T cells. Virus was concentrated as previously described (45), and transduction efficiency was determined at MOI from 0.01 to 1 on HT1080 cells. There was a linear correlation of transduction efficiency and MOI in all cases. An indicative picture at an MOI of 1 is shown here. Transduction efficiency was 50 to 60% with either genome, gag-pol, and either large or small amounts of pSYNGP. Titers before concentration (TU/ml) on 293T cells: 6.6 × 10⁵ (A); 7.6 × 10⁵ (B); 9.2 × 10⁵ (C); 1.5 × 10⁵ (D); titers before concentration (TU/ml) on HT1080 cells: 6.0 × 10⁴ (A); 9.9 × 10⁴ (B); 8.0 × 10⁴ (C); 2.9 × 10⁴ (D). Titers after concentration (TU/ml) on HT1080 cells: 6.0 × 10⁵ (A); 2.0 × 10⁶ (B); 1.4 × 10⁶ (C); 2.0 × 10⁵ (D).

Similar articles

Cited by

References

    1. Adachi A, Gendelman H, Koenig S, Folks T, Willey R, Rabson A, Martin M. Production of acquired immunodeficiency syndrome-associated retrovirus in human and nonhuman cells transfected with an infectious molecular clone. J Virol. 1986;59:284–291. - PMC - PubMed
    1. Afonina E, Neumann M, Pavlakis G. Preferential binding of poly(A)-binding protein I to an inhibitory RNA element in the HIV-1 gag mRNA. J Biol Chem. 1997;272:2307–2311. - PubMed
    1. Andre S, Seed B, Eberle J, Schraut W, Bultmann A, Haas J. Increased immune response elicited by DNA vaccination with a synthetic gp120 sequence with optimized codon usage. J Virol. 1998;72:1497–1503. - PMC - PubMed
    1. Arai T, Takada M, Ui M, Iba H. Dose-dependent transduction of vesicular stomatitis virus G protein-pseudotyped retrovirus vector into human solid tumor cell lines and murine fibroblasts. Virology. 1999;260:109–115. - PubMed
    1. Arrigo S J, Chen I S. Rev is necessary for translation but not cytoplasmic accumulation of HIV-1 vif, vpr, and env/vpu 2 RNAs. Genes Dev. 1991;5:808–819. - PubMed

Publication types

MeSH terms

LinkOut - more resources