. 2000 May 1;20(9):3115-28.
doi: 10.1523/JNEUROSCI.20-09-03115.2000.

Reluctant gating of single N-type calcium channels during neurotransmitter-induced inhibition in bullfrog sympathetic neurons

Affiliations

Reluctant gating of single N-type calcium channels during neurotransmitter-induced inhibition in bullfrog sympathetic neurons

H K Lee et al. J Neurosci. .

Abstract

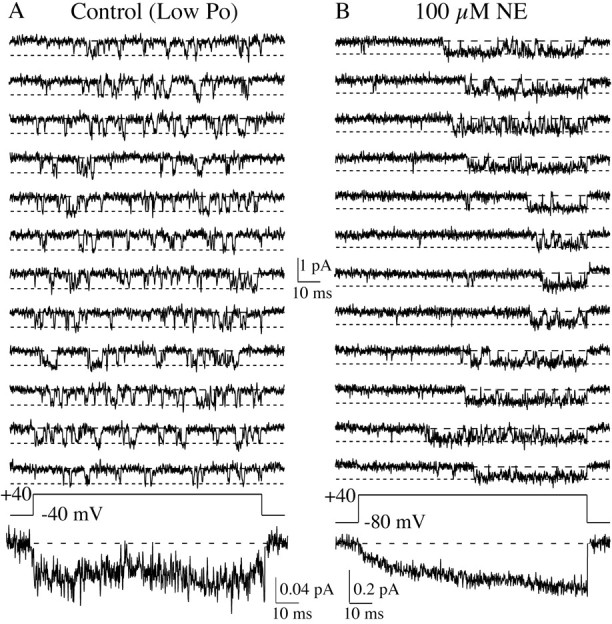
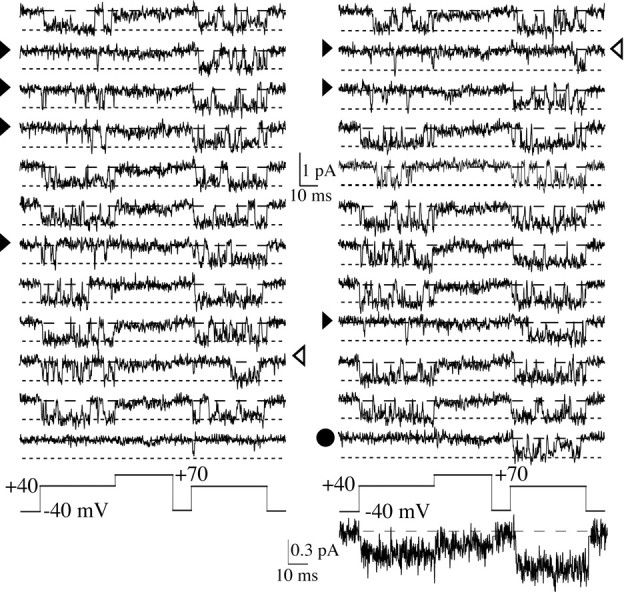
Whole-cell recordings have been used to extensively characterize the voltage-dependent inhibition of N-type calcium current induced by various neurotransmitters. Results from these studies have yielded several predictions on the effect of inhibition on N-channel gating, namely delayed channel opening and inhibition-induced reluctant openings. Previous single N-channel studies observed delayed channel opening but failed to find reluctant openings. However, strong depolarizations may be necessary to see reluctant openings, but this was not tested. We have examined N-channel gating at voltages depolarized to those used previously and found a neurotransmitter-induced open state that has properties predicted for the reluctant open state. The openings had lower open probability (P(o)) and brief open times compared to the dominant gating state observed in control (high P(o)). These reluctant events were reduced after strong depolarizing pulses used to reverse inhibition. The threshold voltage for activation of reluctant events was approximately 30 mV depolarized to that of the normal gating state (high P(o)). However, an action potential will provide sufficient depolarization to open reluctant N-channels.


Figures

Fig. 1.
Fig. 1.
The willing–reluctant model with rate constants (in sec−1) derived from whole-cell data from frog sympathetic neurons (Elmslie et al., 1990). The rate constants for normal opening and closing are k1 = 200e+0.06(V + 5) andk−1 = 200e−0.06(V + 5), respectively. WC and WO represent the willing closed and open states, respectively. RC and RO represent the reluctant closed and open states, respectively.
Fig. 2.
Fig. 2.
NE induces voltage dependent inhibition of single N-type calcium channels. Eight consecutive sweeps are shown from a patch under control conditions (A) and another patch exposed to 100 μm NE (B). The control patch contained one N-channel and at least one Ef-channel. The NE patch contained only a single N-channel. NE inhibited N-channel activity during the prepulse (preceding the +70 mV conditioning pulse). However, the conditioning pulse restored N-channel activity during the postpulse. At the bottom of each set of individual sweeps is the pseudomacroscopic current, which was generated by averaging 90 sweeps for A and 100 sweeps forB. The difference between the number of sweeps averaged results from exclusion of sweeps that contain transient noise events (Elmslie, 1997). The line with long dashes indicates the zero current level, and theline with the short dashes indicates the open channel current level.
Fig. 3.
Fig. 3.
Variable effects of NE on single N-channels. Prepulse and postpulse pseudomacroscopic currents were measured as the average between 5 and 15 msec into the 40 msec depolarization to +30 mV. The ratio of postpulse current to prepulse current was calculated for six control patches and 18 patches exposed to 100 μmNE. A ratio of ∼1 indicates no modulation, whereas ratios > 1 are positively correlated with the magnitude of inhibition.
Fig. 4.
Fig. 4.
NE increases the delay to channel opening.A,B, Consecutive sweeps are shown for four voltages from control and NE patches. The control data from 20–40 mV are from one patch, and the data at +50 mV are from a separate patch. Each patch contained one N-channel and at least one Ef-channel. The NE data from 20–40 mV are from one, and the data at +50 mV are from a separate patch. Each patch contained only a single N-channel. The NE concentration was 100 μm for 20–40 mV data and 30 μm for the +50 mV data. The pseudomacroscopic currents for each voltage are shown beneath the relevant sweeps. C, The latency to first channel opening was measured and binned into a cumulative histogram (0.2 msec bin width). To show the effect of NE on the distribution, the histograms were normalized to the number of events in the last bin. The number of sweeps used to generate the histograms were 85 and 47 (+20 mV), 80 and 70 (+30 mV), 37 and 93 (+40 mV), and 238 and 114 (+50 mV) for control and NE patches, respectively.
Fig. 5.
Fig. 5.
NE induces a long shut time at +40 and +50 mV. Log binned distributions of shut time measured from control and NE (30 μm) patches. The histogram was generated with 10 bins/decade. The control data are from a single patch that contained one N-channel and at least one Ef-channel. The NE data from 20–40 mV are from one patch, and the data at +50 mV are from a separate patch. Each NE patch contained only a single N-channel. Thesmooth lines were generated from either double or triple exponential fits to the data. The resulting time constants (τsh) are listed along with the number of events used to generate the distribution.
Fig. 6.
Fig. 6.
NE induces brief openings at +40 and +50 mV, but not at more hyperpolarized voltages. Log binned histograms (10 bins/decade) of open times are shown for N-channel activity from a control and NE patches (30 μm). The control and NE data are from same patches used for shut time histograms (Fig. 5). The solid lines on the +20 and +30 mV histograms were generated by single exponential fits. The control +40 mV histogram was also fit by a single exponential. However, for the +40 mV histogram in NE and the +50 mV histograms (control and NE), the dashed line is the single exponential fit to the data, whereas the solid line is a double exponential fit. The time constants (τo) from the fits are listed for each histogram. The number of events used to generate the distribution is listed on each histogram.
Fig. 7.
Fig. 7.
NE induces reluctant gating that is characterized by brief openings followed by long closings. Open times are plotted against the following shut time for data from all patches containing one N-channel. The line indicates Po = 0.2 and is presented to highlight gating differences between NE and control. Control data are from seven patches for 20–40 mV and two patches for 50 mV. NE data are from five patches for 20 mV, six patches for 30 and 40 mV, and two patches for 50 mV. The number of control open time and shut time pairs plotted are 8311 (20 mV), 14,165 (30 mV), 13,928 (40 mV), and 5080 (50 mV). The number of events plotted in NE are 1015 (20 mV), 3081 (30 mV), 6199 (40 mV), and 2155 (50 mV). The NE concentration was either 30 or 100 μm for 20–40 mV data, but only 30 μm for 50 mV data.
Fig. 8.
Fig. 8.
A comparison of low Pogating (control) and NE-induced brief openings. A,Twelve consecutive sweeps show the continuous lowPo gating that can be observed in N-channels recorded from control patches. This patch contained only a single N-channel. Note that the low Po gating does not introduce a slow component of activation to the pseudomacroscopic current (averaged from 88 sweeps). B, To compare the NE-induced brief events with low Po gating, twelve nonconsecutive sweeps are shown. Nonconsecutive sweeps were used since sweeps with NE-induced brief events are not clustered like those showing low Po gating. This patch contained only a single N-channel. Note the slow activation of the pseudomacroscopic current (average of 95 sweeps).
Fig. 9.
Fig. 9.
Strong depolarization converts reluctant events into high Po gating. Twenty-four consecutive sweeps illustrate the effect of 100 μm NE on N-channel gating. The black arrowheads indicate the sweeps with reluctant openings during the prepulse. The open arrowheads show the sweeps with delayed channel opening and reluctant events during the postpulse. The black circlesshow sweeps with no openings during the prepulse, but highPo gating during the postpulse. Note from the prepulses that the channel switches between control-like (short latency to high Po gating) and inhibited gating. This patch contained only a single N-channel. The pseudomacroscopic current shown at the bottom is an average of 99 sweeps. Facilitation measured from this pseudomacroscopic current was 1.9.
Fig. 10.
Fig. 10.
Strong depolarization shifts the gating of inhibited N-channels from reluctant to highPo at +40 mV.Po-ex was measured for each sweep by dividing the sum of open times by the sum of shut times (excluding the first and last shut times; see Materials and Methods). Data from three patches exposed to 100 μm NE are included in the histogram. The bin width was 0.05 Pounits.
Fig. 11.
Fig. 11.
The conditioning pulse reduces reluctant events at +40 mV. Individual events were plotted as their open time versus the following shut time. The data are from the same three patches in Figure10. The solid line indicatesPo = 0.2 and is presented to highlight gating differences at +40 mV. The percentage of events beyond thePo < 0.2 line were 40 and 40% (+20 mV), 17 and 16% (+30 mV), and 21 and 9% (+40 mV) for the prepulse and postpulse sweeps, respectively. The number of open time and shut time pairs plotted are 246 and 523 (+20 mV), 524 and 1174 (+30 mV), and 830 and 1612 (+40 mV) for the prepulse and postpulse sweeps, respectively.
Fig. 12.
Fig. 12.
The conditioning step partially recovers Po of the postpulse sweeps in NE exposed patches. Po was measured as the sum of open times divided by the sweep duration (including the latency to channel opening). The mean Po was averaged from all sweeps (including nulls) at the indicated voltage to provide an estimate of mean N-channel activity during macroscopic recordings. The Po from prepulse sweeps are indicated asopen symbols, whereas those from postpulse sweeps are indicated as solid symbols. Separate symbols are used for data from each control patch and each NE patch. Data are plotted from three control patches (except n = 4 at +30 mV and n = 2 at +10 mV) and four NE patches (exceptn = 3 at +40 mV). The dashed linesare Boltzmann fits to the prepulse data, and solid linesare Boltzmann fits to the postpulse data. The fits to control data were unconstrained (see Materials and Methods). However, the fit to the postpulse data in NE was constrained so that the slope was 6, and the fit to the prepulse data was constrained so that the maximumPo was equal to that of the postpulse (see Materials and Methods). The parameters for the fits in control wereV1/2 = 33.7 and 32.5 mV, slope 6.0 and 5.6 mV/e-fold, Po max = 0.84 and 0.74 for prepulse and postpulse data, respectively. The parameters for the fits in NE were V1/2 = 44.3 and 28.4 mV, slope 10.9 and 6 mV/e-fold, Po max = 0.37 and 0.37 for prepulse and postpulse data, respectively.
Fig. 13.
Fig. 13.
NE can delay channel opening during the postpulse. A, Cumulative histograms of the latency to first channel opening are shown for prepulse (dashed line) and postpulse (solid lines) sweeps. NE is placed between the postpulse and prepulse histograms from the patch exposed to NE. To illustrate the effect of NE on the distributions, the histograms have been normalized to the number of sweeps in last bin. The data for the histogram were combined from three control patches and three NE patches. The number of sweeps used was 212 and 207 (control) and 173 and 223 (NE) for prepulse and postpulse, respectively.B, Example sweeps from the same NE-exposed patch shown in A. The vertical dashed line shows the beginning of the postpulse. Note the delayed channel opening in these postpulse sweeps.
Fig. 14.
Fig. 14.
Interpretation of single-channel gating using the willing–reluctant model. The model is shown to theright. WC and WO represent willing closed and open states, and RC and RO represent reluctant closed and open states, respectively. The curly bracket shows the region of the single-channel records where we believe the channel to be gating reluctantly. The square bracket shows the region of the records where the channel is gating in the highPo mode (willing). The three sweeps are nonconsecutive, and this patch contained two N-channels.

Similar articles

Cited by

References

    1. Adams PR, Jones SW, Pennefather P, Brown DA, Koch C, Lancaster B. Slow synaptic transmission in frog sympathetic ganglia. J Exp Biol. 1986;124:259–285. - PubMed
    1. Bean BP. Neurotransmitter inhibition of neuronal calcium currents by changes in channel voltage dependence. Nature. 1989;340:153–156. - PubMed
    1. Beech DJ, Bernheim L, Hille B. Pertussis toxin and voltage dependence distinguish multiple pathways modulating calcium channels of rat sympathetic neurons. Neuron. 1992;8:97–106. - PubMed
    1. Boland LM, Bean BP. Modulation of N-type calcium channels in bullfrog sympathetic neurons by luteinizing hormone-releasing hormone: kinetics and voltage dependence. J Neurosci. 1993;13:516–533. - PMC - PubMed
    1. Brody DL, Patil PG, Mulle JG, Snutch TP, Yue DT. Bursts of action potential waveforms relieve G-protein inhibition of recombinant P/Q-type Ca2+ channels in HEK 293 cells. J Physiol (Lond) 1997;499:637–644. - PMC - PubMed

Publication types

MeSH terms

LinkOut - more resources