. 2000 May 1;20(9):3147-56.
doi: 10.1523/JNEUROSCI.20-09-03147.2000.

Slow death of postnatal hippocampal neurons by GABA(A) receptor overactivation

Affiliations

Slow death of postnatal hippocampal neurons by GABA(A) receptor overactivation

W Xu et al. J Neurosci. .

Abstract

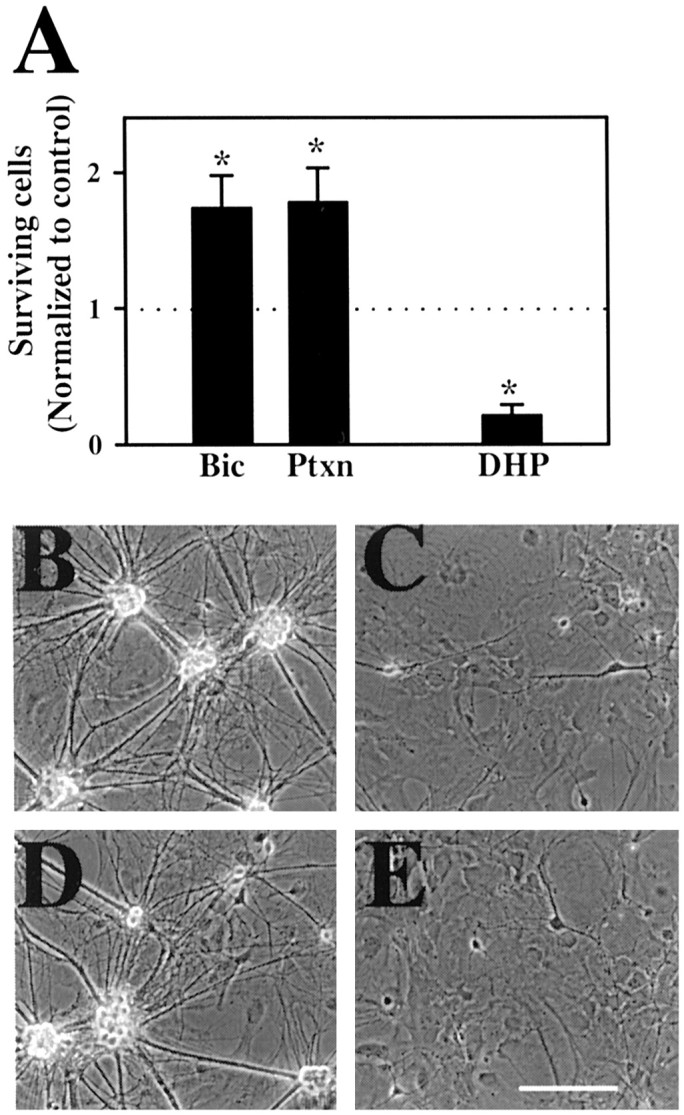
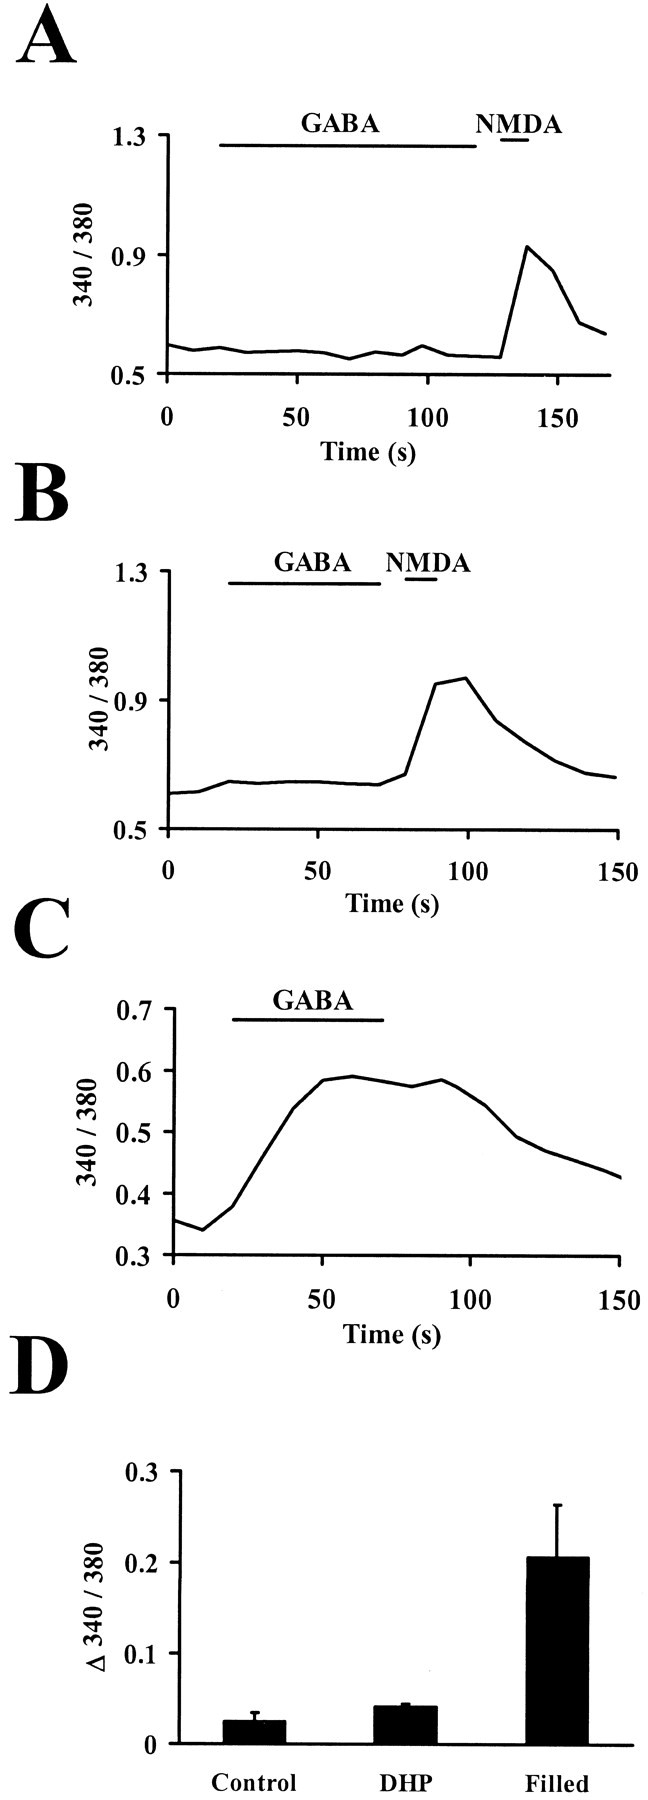
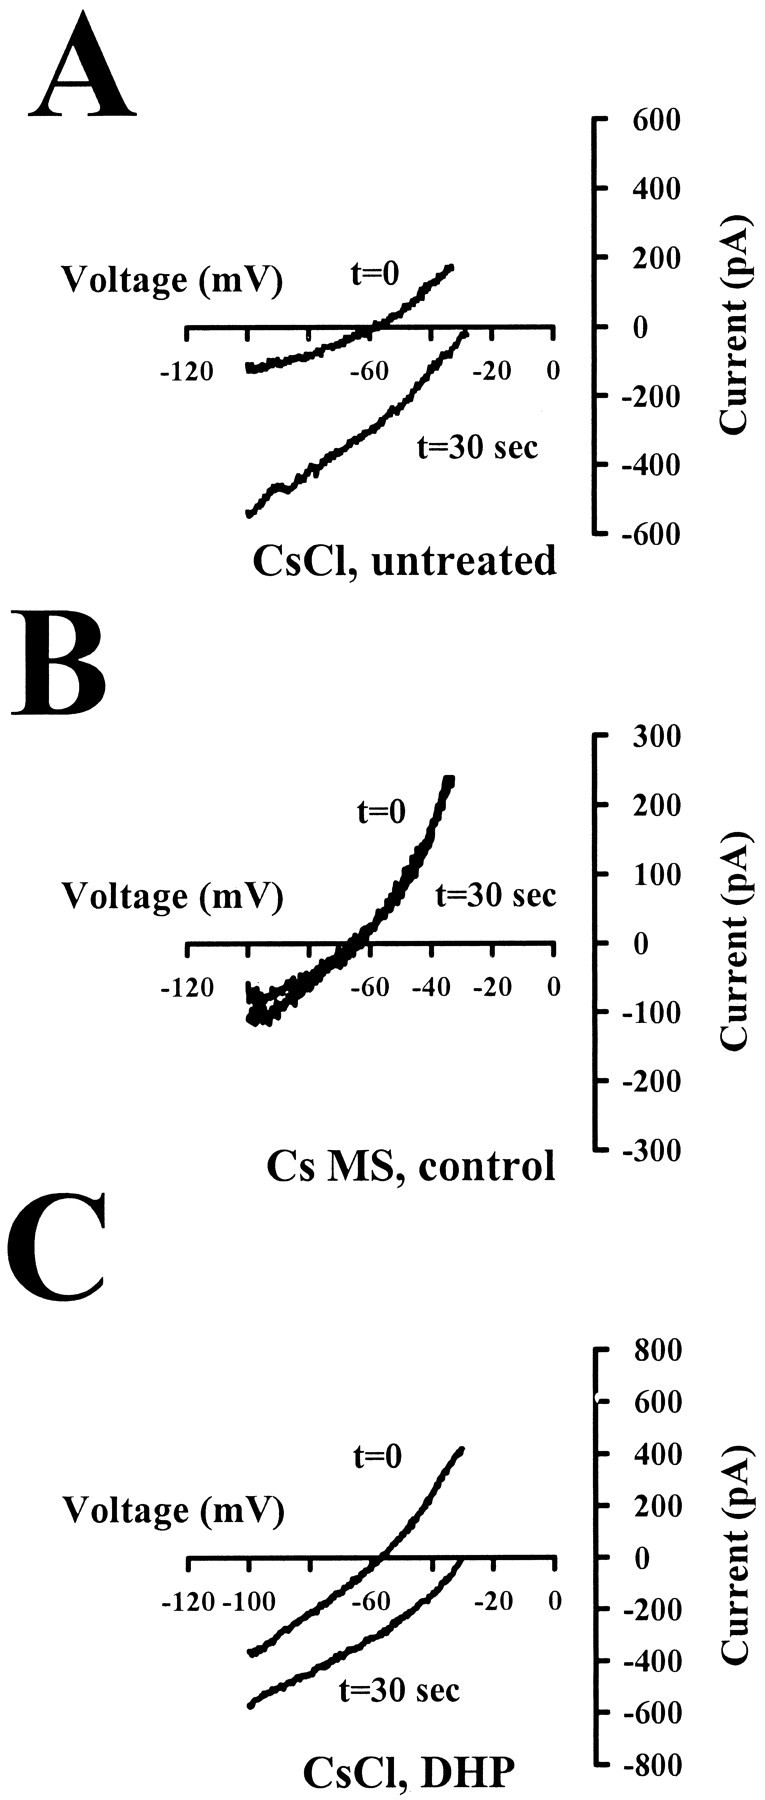
Neurotransmitters can have both toxic and trophic functions in addition to their role in neural signaling. Surprisingly, chronic blockade of GABA(A) receptor activity for 5-8 d in vitro enhanced survival of hippocampal neurons, suggesting that GABA(A) receptor overactivation may be neurotoxic. Potentiating GABA(A) receptor activity by chronic treatment with the endogenous neurosteroid (3alpha,5alpha)-3-hydroxypregnan-20-one caused massive cell loss over 1 week in culture. Other potentiators of GABA(A) receptors, including benzodiazepines, mimicked the cell loss, suggesting that potentiating endogenous GABA activity is sufficient to produce neuronal death. Neurosteroid-treated neurons had lower resting intracellular calcium levels than control cells and produced smaller calcium rises in response to depolarizing challenges. Manipulating intracellular calcium levels with chronic elevated extracellular potassium or with the calcium channel agonist Bay K 8644 protected neurons. The results may have implications for the mechanisms of programmed cell death in the developing CNS as well as implications for the long-term consequences of chronic GABAmimetic drug use during development.


Figures

Fig. 1.
Fig. 1.
Prevention and exacerbation of neuronal death by manipulating GABAA receptors. A, Cell survival at DIV 10–12 assessed by cell counts of randomly selected microscopic fields after chronic treatment begun at DIV 4 with 50 μm bicuculline (Bic; n= 13 platings; p < 0.05) or with 10 μm picrotoxinin (Ptxn;n = 10 platings; p < 0.05). The GABAA potentiating neurosteroid DHP (3 μm) depressed cell numbers evaluated at DIV 10–13 (p < 0.05; n = 6 platings) Counts in this and subsequent figures are expressed normalized to counts of control cultures from the same plating. Thedotted line in this and subsequent graphs denotes the normalized control counts (1.0). B–E, Photomicrographs of control postnatal hippocampal cultures (B) and cultures treated with 3 μm DHP (C–E). The photographs were obtained at DIV 13. Treatments were begun at DIV 4. C, Photomicrograph from a culture treated with 3 μm DHP alone. D, Cells treated with DHP and 50 μm bicuculline.E, Cells treated with 3 μm DHP and 0.1 μm RU486. Scale bar, 130 μm (applies toB–E).
Fig. 2.
Fig. 2.
Time course and concentration dependence of DHP-mediated neuronal death. A, The graph represents one experiment in which cell counts were made at sequential time points during DHP treatment. Counts of DHP-treated cultures were significantly different from control cultures at DIV 8 and 10 (treatment days 5 and 7). In the graph, counts of individual microscopic fields, including those of control dishes, were expressed relative to the mean control counts; thus both control and experimental treatment groups show error bars. B, The graph represents the effects of treatment of cultures with 0.3, 1.5, and 3.0 μm DHP. Cell counts were obtained at DIV 10. C, Lack of metabolism of steroids in culture. A bioassay was used to determine the amount of steroid remaining in cultures 10 d after treatment. Conditioned medium (CM) from DIV 14 cultures was harvested from untreated cultures or cultures treated with 3 μmDHP. Unconditioned medium (UM) was used as a comparison and was either spiked immediately before use with 3 μm DHP (+DHP) or left untreated. For all samples, hydrophobic steroids were separated from hydrophilic molecules using a Baker 10 SPE octadecyl column. The hydrophobic fraction was eluted with methanol, dried, and resuspended inXenopus oocyte recording medium to a final predicted concentration of 1 μm DHP for the DHP-treated samples (assuming no degradation in the conditioned medium samples). This final concentration of DHP (1 μm) was used for evaluation because it is near the EC50 for modulation of GABAA receptors (Zorumski et al., 1998). GABA (1 μm) was added to each of the reconstituted samples. Solutions containing GABA alone or the diluted culture medium were applied to voltage-clamped Xenopus oocytes. The amplitudes of responses to each solution are expressed relative to the response to GABA alone in the bar graph.Inset, Raw traces from a representative oocyte. Experimental conditions for the inset are in the order shown on the bar graph.
Fig. 3.
Fig. 3.
Late treatment with neurosteroid also promotes slow neuronal death. A, B, Photomicrographs (DIV 14) of hippocampal cultures treated with vehicle (A) or with 3 μm DHP beginning on DIV 7 rather than the usual DIV 4. Scale bar, 130 μm.C, Time course of neuronal death when cells were acutely treated 3 μm DHP at DIV 7. Each pointrepresents 15–21 microscopic fields.
Fig. 4.
Fig. 4.
Other potentiators of GABA actions at GABAA receptors also cause slow neuronal death.A–C are from one plating; D–F are from another plating. A, Control culture. B, Lorazepam (10 μm). C, Pentobarbital (50 μm). D, Culture treated with bicuculline (50 μm) alone. E, Lorazepam (5 μm). F, Culture treated with 5 μm lorazepam plus 50 μm bicuculline. Photomicrographs were obtained at DIV 10–11, and treatments were begun at DIV 4. Scale bars, 130 μm (bar in C applies toA–C; bar in F applies toD–F).
Fig. 5.
Fig. 5.
Intracellular calcium responses suggest that GABA is not excitatory. A–C, Calcium rises were measured in response to 100 μm GABA applied by local perfusion to cultured neurons at DIV 8–10. Raw traces represent ratiometric Fura-2 images from a control neuron (A), DHP-treated neuron (B), and a control neuron loaded with 140 mm chloride (C) using a whole-cell recording pipette. In A and B, cells were also challenged with 300 μm NMDA in extracellular saline containing no added Mg2+ and 5 μmglycine to confirm the ability of neurons to respond to excitation with a calcium increase. D, Summary of the calcium increases to application of 100 μm GABA under the three conditions in A–C. Cells were either untreated (Control; n = 35 cells) or had been treated with DHP on DIV 3 (DHP; n = 37). Positive control data (filled) came from three neurons filled with 140 mm KCl in a whole-cell recording pipette containing 60 μm fura-2. The data are from one plating but are representative of three independent experiments in which no calcium response from 100 μm GABA was observed.
Fig. 6.
Fig. 6.
Endogenous GABA reversal potentials suggest GABA is inhibitory in hippocampal cultures. A, Example current–voltage curve from an untreated cell at DIV 8. The curve was generated by subtracting the current response to a voltage ramp in the absence of 0.5 μm GABA from the response to the same ramp in the presence of GABA. The protocol was performed immediately on achieving the whole-cell recording mode (t = 0) or 30 sec after membrane rupture (t = 30).B, The same protocol was performed on another cell but using methane sulfonate as the primary anion in the pipette solution.C, The same protocol was performed on a cell from the same plating but treated with DHP for 6 d.
Fig. 7.
Fig. 7.
Intracellular Ca2+ and GABAmimetic treatment. A, KCl-evoked transient calcium rises are depressed by chronic DHP treatment. Calcium influx was stimulated with a 30 sec application of 30 mm KCl. Note that imaging was performed in the absence of DHP on cells 5 d after initiation of DHP treatment. The depressed change in fluorescence suggests depressed calcium influx in DHP-treated cells (open bar; n = 57 cells) versus control cells (solid bar; n = 50 cells). *p < 0.01. The data represent one experiment from a single plating but are representative of four replications in independent platings. B, Calcium is chronically increased by growing cells in the presence of 35 mm KCl or in the presence of 1.5 μm Bay K 8644. Bay K or KCl was added simultaneously with DHP, and imaging was performed 48 hr after treatment (n = 530–914 cells for each condition, representative of results on four different plates).
Fig. 8.
Fig. 8.
Neuroprotective effects of elevated extracellular potassium. A, Representative photomicrograph of a culture treated with elevated KCl (35 mm total) on DIV 4.B, Sister culture treated with 35 mm KCl and 3 μm DHP. C, Control culture grown with normal (5 mm) potassium. D, DHP-treated culture in normal potassium. E, F, Altered neuronal density does not explain the effect of elevated KCl. Cells were initially plated at one-third the normal density and treated with either elevated extracellular potassium alone (E) or elevated potassium and 3 μmDHP (F). Scale bars, 130 μm (bar inF applies to C–F; bar inH applies to G, H).G, Effect of KCl on muscimol toxicity.Bars represent normalized neuronal counts of cultures treated with muscimol alone (10 μm), 35 mmpotassium alone, or muscimol plus KCl (n = 4 experiments; all conditions, p < 0.05 vs control;p = 0.06 for KCl vs KCl plus muscimol conditions).
Fig. 9.
Fig. 9.
An L-type calcium channel agonist is neuroprotective. A–D, Representative fields from sister cultures A, Control culture. B, Muscimol (10 μm)-treated. C, Bay K 8644 (1.5 μm). D, Bay K 8644 plus muscimol.E, Summary data representing cell counts from four independent platings assessed at DIV 8. Average cell counts from the Bay K 8644 treatment alone but not the Bay K 8644 plus muscimol group were significantly different from control (p= 0.04 and 0.31, respectively; n = 6 experiments). Cell numbers from the Bay K 8644 alone condition were also significantly different from the Bay K 8644 plus muscimol condition (p = 0.02), suggesting only partial protection by Bay K 8644. Scale bar, 130 μm.

Similar articles

Cited by

References

    1. Ankarcrona M. Glutamate induced cell death: apoptosis or necrosis? Prog Brain Res. 1998;116:265–272. - PubMed
    1. Bhave SV, Ghoda L, Hoffman PL. Brain-derived neurotrophic factor mediates the anti-apoptotic effect of NMDA in cerebellar granule neurons: signal transduction cascades and site of ethanol action. J Neurosci. 1999;19:3277–3286. - PMC - PubMed
    1. Castoldi AF, Barni S, Randine G, Costa LG, Manzo L. Ethanol selectively interferes with the trophic action of NMDA and carbachol on cultured cerebellar granule neurons undergoing apoptosis. Brain Res Dev Brain Res. 1998;111:279–289. - PubMed
    1. Chen Q, Olney JW, Lukasiewicz PD, Almli T, Romano C. Ca2+-independent excitotoxic neurodegeneration in isolated retina, an intact neural net: a role for Cl− and inhibitory transmitters. Mol Pharmacol. 1998;53:564–572. - PubMed
    1. Cherubini E, Rovira C, Gaiarsa JL, Corradetti R, Ben Ari Y. GABA mediated excitation in immature rat CA3 hippocampal neurons. Int J Dev Neurosci. 1990;8:481–490. - PubMed

Publication types

MeSH terms

Substances

LinkOut - more resources