. 2000 May 1;20(9):3157-64.
doi: 10.1523/JNEUROSCI.20-09-03157.2000.

Ethanol-associated behaviors of mice lacking norepinephrine

Affiliations

Ethanol-associated behaviors of mice lacking norepinephrine

D Weinshenker et al. J Neurosci. .

Abstract

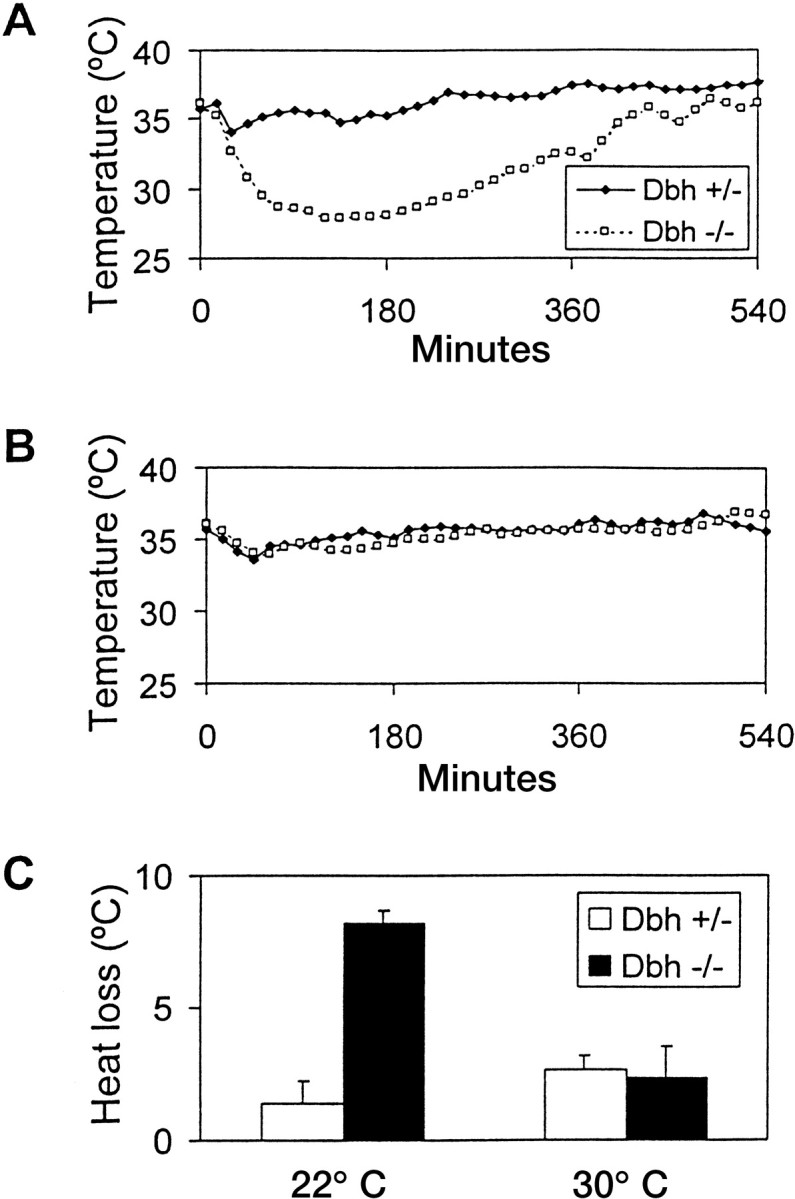
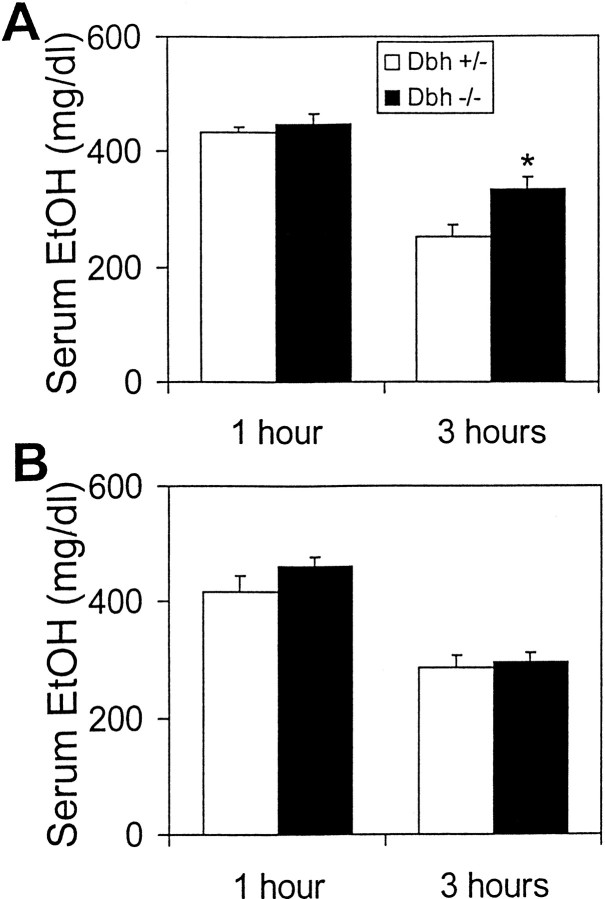
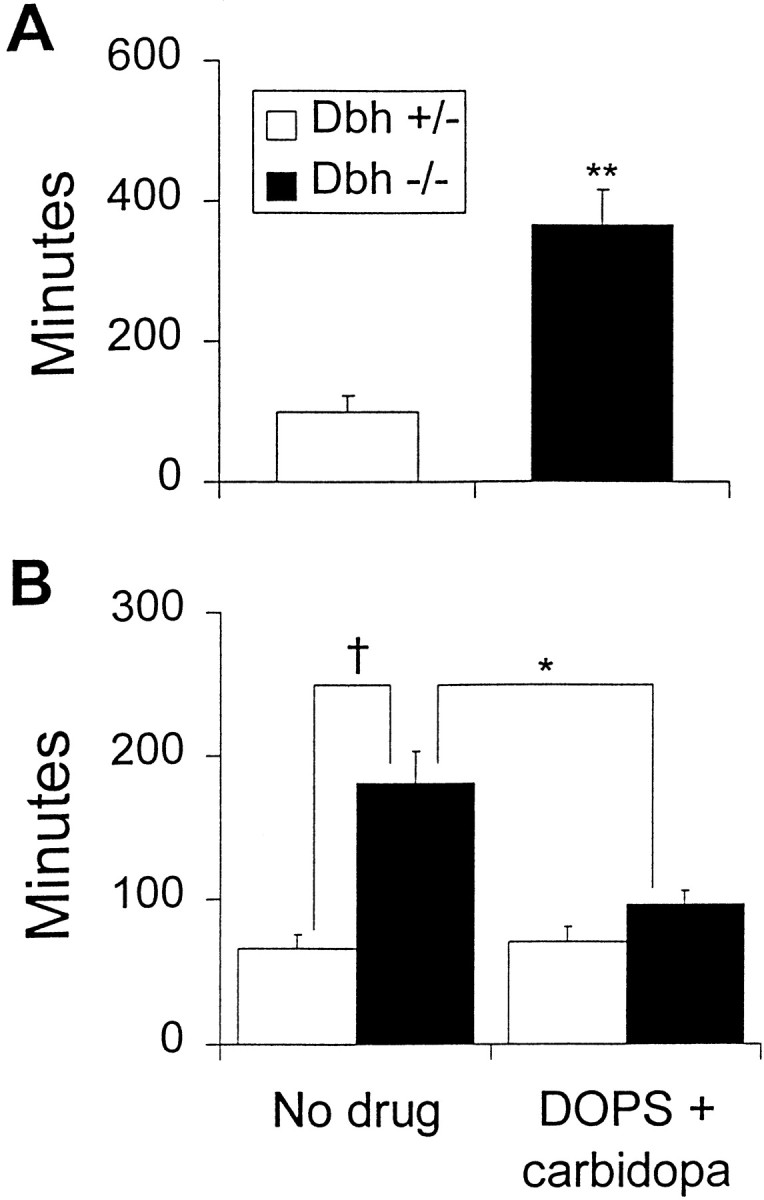
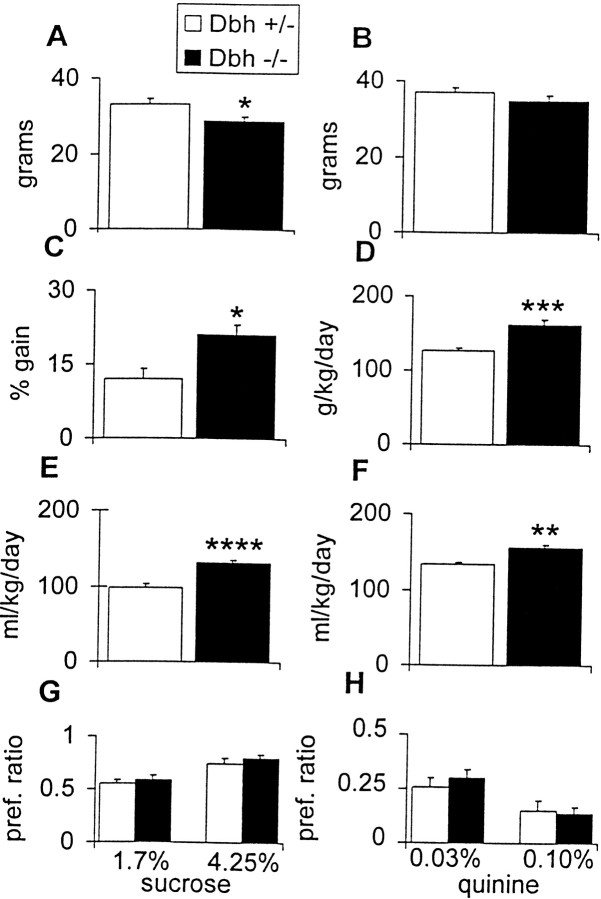
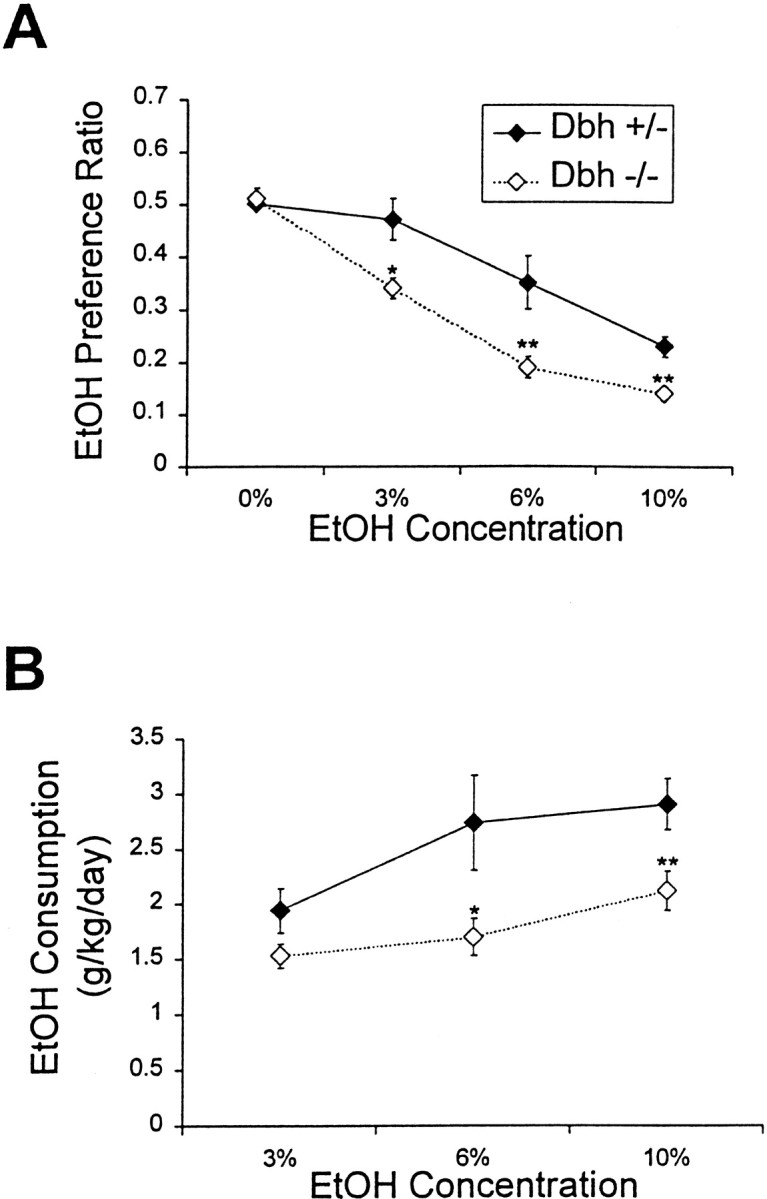
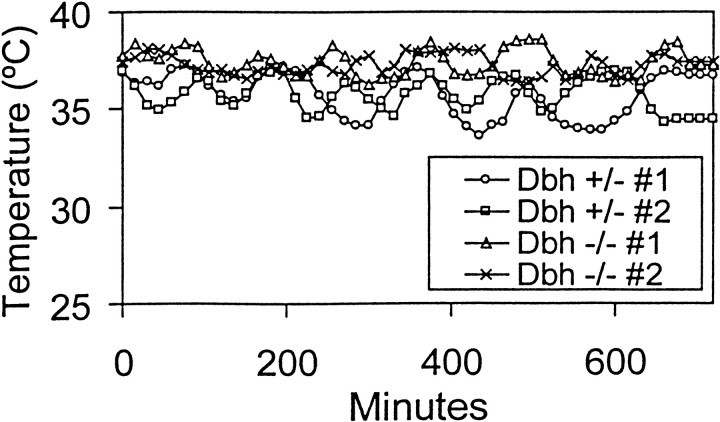
Although norepinephrine (NE) has been implicated in animal models of ethanol consumption for many years, the exact nature of its influence is not clear. Lesioning and pharmacological studies examining the role of NE in ethanol consumption have yielded conflicting results. We took a genetic approach to determine the effect of NE depletion on ethanol-mediated behaviors by using dopamine beta-hydroxylase knockout (Dbh -/-) mice that specifically lack the ability to synthesize NE. Dbh -/- males have reduced ethanol preference in a two-bottle choice paradigm and show a delay in extinguishing an ethanol-conditioned taste aversion, suggesting that they drink less ethanol in part because they find its effects more aversive. Both male and female Dbh -/- mice are hypersensitive to the sedative and hypothermic effects of systemic ethanol administration, and the sedation phenotype can be rescued pharmacologically by acute replacement of central NE. Neither the decreased body temperature nor changes in ethanol metabolism can explain the differences in consumption and sedation. These results demonstrate a significant role for NE in modulating ethanol-related behaviors and physiological responses.


Figures

Fig. 1.
Fig. 1.
Ethanol-induced changes in body temperature. Representative hypothermic response to acute administration of 3 gm/kg ethanol at (A) 22° ambient temperature and (B) 30° ambient temperature. Each data point is an average of three 5 min measurements. C, Mean hypothermic response at 22° (Dbh +/−,n = 4; Dbh −/−,n = 3) and 30° (Dbh +/−,n = 3; Dbh −/−,n = 3). No sex differences were found, and results were combined.
Fig. 2.
Fig. 2.
Ethanol metabolism. Serum ethanol concentration 1 and 3 hr after an acute injection of 3 gm/kg ethanol at (A) 22° ambient temperature and (B) 30° ambient temperature (n = 6 for each genotype at each time point). *p < 0.05.
Fig. 3.
Fig. 3.
Ethanol-induced sedation. Latency to regain righting reflex after an acute injection of 3 gm/kg ethanol at (A) 22° ambient temperature (Dbh+/−, n = 6; Dbh −/−,n = 6) and (B) 30° ambient temperature (Dbh +/−, n = 18;Dbh −/−, n = 20). DOPS (1 mg/gm) + carbidopa (0.125 mg/gm) (Dbh +/−, n= 13; Dbh −/−, n = 12) was administered 5 hr before ethanol injection. *p < 0.05; **p < 0.01; † p < 0.0001.
Fig. 4.
Fig. 4.
Body weight and consumption measurements during preference study. A, Body weight before start of preference study. B, Body weight after conclusion of preference study. C, Weight gain during preference study calculated as a percentage of starting weight. D, Average food consumption over course of preference study.E, Average water consumption over course of preference study. F, Average total fluid (water + ethanol) over course of preference study. G, Sucrose preference ratio (weight of sucrose solution consumed/weight of total fluid consumed).H, Quinine preference ratio (weight of quinine solution consumed/weight of total fluid consumed). *p < 0.05; **p < 0.01; ***p < 0.001; ****p < 0.0001.
Fig. 5.
Fig. 5.
Ethanol preference and consumption.A, Ethanol preference ratio (weight of ethanol consumed/weight of total fluid consumed) of males (Dbh+/−, n = 18; Dbh −/−,n = 18). B, Male ethanol consumption calculated as grams of ethanol per kilogram of body weight. *p < 0.05; **p < 0.01.
Fig. 6.
Fig. 6.
Body temperature during voluntary ethanol consumption. Shown is measurement of body temperature over 12 hr with 3% ethanol the only fluid available (Dbh +/−,n = 2; Dbh −/−,n = 2).
Fig. 7.
Fig. 7.
Conditioned taste aversion. A, Percentage of preconditioning saccharin solution consumed after the third conditioning trial (n = 6 for each group except for EtOH unpaired Dbh −/−,n = 4). Saccharin preference ratio (weight of saccharin solution consumed/weight of total fluid consumed) after the third conditioning trial for (B) ethanol-paired mice and (C) LiCl-paired mice. *p < 0.05.·

References

    1. Alaniz RC, Thomas SA, Perez-Melgosa M, Mueller K, Farr AG, Palmiter RD, Wilson CB. Dopamine β-hydroxylase deficiency impairs cellular immunity. Proc Natl Acad Sci USA. 1999;96:2274–2278. - PMC - PubMed
    1. Amit Z, Brown ZW. Actions of drugs of abuse on brain reward systems: a reconsideration with specific attention to alcohol. Pharmacol Biochem Behav. 1982;17:233–238. - PubMed
    1. Amit Z, Brown ZW, Levitan DE, Ogren SO. Noradrenergic mediation of the positive reinforcing properties of ethanol: I. Suppression of ethanol consumption in laboratory rats following dopamine-beta-hydroxylase inhibition. Arch Int Pharmacodyn Ther. 1977;230:65–75. - PubMed
    1. Andreas K, Fischer HD, Schmidt J. Effect of central effective substances on alcohol preference. Biomed Biochim Acta. 1983;42:391–398. - PubMed
    1. Aston-Jones G, Bloom FE. Activity of norepinephrine-containing locus coeruleus neurons in behaving rats anticipates fluctuations in the sleep-waking cycle. J Neurosci. 1981;1:876–886. - PMC - PubMed

Publication types

MeSH terms