. 2000 May 1;20(9):3254-62.
doi: 10.1523/JNEUROSCI.20-09-03254.2000.

c-Raf regulates cell survival and retinal ganglion cell morphogenesis during neurogenesis

Affiliations

c-Raf regulates cell survival and retinal ganglion cell morphogenesis during neurogenesis

B Pimentel et al. J Neurosci. .

Abstract

The signaling cascade Ras/Raf/mitogen-activated protein kinases modulates cell proliferation, differentiation, and survival, all key cellular processes during neural development. To better define the in vivo role of Raf during chick retinal neurogenesis, we interfered with Raf-dependent signaling during days 4.5 to 7.5 of embryonic development by expressing a dominant negative mutant of c-Raf (DeltaRaf), which blocks Ras-dependent Raf activation, and by overexpressing wild-type c-Raf. DeltaRaf expression induced an increase in cell death by apoptosis, whereas it did not affect overall cell proliferation and differentiation. In parallel, the number of Islet-1/2-positive and TUJ1-positive retinal ganglion cells were diminished in their definitive layer, whereas there was an increase in the number of mislocated Islet-1/2-positive cells. This disturbed morphogenesis correlated with a disruption of the optic fiber layer. Conversely, c-Raf overexpression caused moderate opposite effects on apoptosis. These results frame in vivo early neurogenesis processes in which c-Raf is essential.


Figures

Fig. 1.
Fig. 1.
Retroviral infection of chick embryonic retina.A, Schematic representation of the viral injection at E4.5, as described in Materials and Methods. Viral infection was monitored by immunostaining with the monoclonal antibody anti-Gag19, as shown in B–D. B, A low-magnification micrograph of a whole-mount stained infected retina. C, A stained retinal cryosection shows the widespread, clonal-reminiscent distribution of the infected cells. The retinal layers are indicated:on, optic nerve head; pe, pigmented epithelium; ONL, outer nuclear layer;INL, inner nuclear layer; GCL, ganglion cell layer; v, vitreous humor. D, A representative immunoblot of infected neuroretinas. Compare the expression levels between the injected and the contralateral eye of the same embryo. Infected chick embryonic fibroblasts (CEF) and the retina of a noninjected embryo (Control) are shown. Scale bar: B, 1 mm; C, 50 μm.
Fig. 2.
Fig. 2.
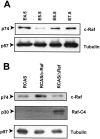
Endogenous expression of c-Raf and interference by viral infection. A, A representative immunoblot of retinal extracts of the indicated embryonic days revealing the endogenous c-Raf expression in the retina. B, A representative immunoblot showing c-Raf expression 48 hr after injection of virus, as well as Raf-C4 expression 72 hr after injection of virus. Note that both the endogenous expressed chick c-Raf and the virally transferred human c-Raf are recognized by the antibody used and comigrate in the gel. All the blots were restained for tubulin to allow for relative quantitation.
Fig. 3.
Fig. 3.
Interference with Raf affects prominently cell survival, but not proliferation and differentiation. Retinas infected with the indicated viral constructs were processed 48 hr after injection. Apoptosis was visualized by TUNEL in whole-mount retina and scored directly under the microscope or using the Optimas program (3 retinas). The individual values obtained by the different techniques were relativized to those of the RCAS-infected retinas and combined. Proliferation was quantitated by BrdU immunostaining after 1 hr incorporation or by [3H]-thymidine autoradiography after 12 hr incorporation in dissociated cells. Differentiation was determined by Islet-1/2 immunostaining in dissociated cells. In all the determinations in dissociated cells, 500 total cells were counted in duplicates of three infected embryos per viral construct.
Fig. 4.
Fig. 4.
Effect of the interference with Raf on apoptosis and the morphogenesis of the ganglion cells. Retinas injected at E4.5 with the indicated viral constructs were processed for TUNEL in whole-mount retina (A–F) or for immunostaining in retinal cryosection (G–L) 48 hr after injection. Retinas with total dead cell scores closest to the average value (see Fig. 3) were represented as isothanas (A–C; the pseudocolor scale indicates dead cell density per square millimeter). The orientation of the retinas is indicated:N, nasal; T, temporal; D, dorsal; V, ventral. Comparative fields in the temporoventral quadrant were obtained by confocal microscopy of the represented retinas (D–F). Double-stained cryosections for the neuronal cell marker Islet-1/2 (red) and apoptotic cells by TUNEL (green) (G–I). Note that, in the control infection with empty vector (G), at this age, Islet-1/2 is a selective nuclear marker of ganglion cells located in their proper layer. Serial sections stained for the ganglion cell marker TUJ1, which also stains the optic fiber layer (J–L). In all cases, only sections including the lens and the optic nerve were chosen, and temporal fields 0.5 mm away from the optic nerve head are shown. The pigmented epithelium (pe) side is indicated. Scale bar:A–C, 1.5 mm; D–F, 40 μm;G–L, 20 μm.
Fig. 5.
Fig. 5.
Effect of the interference with Raf in the number and distribution of the Islet-1/2-positive neurons. Retinas infected at E4.5 with the indicated viral constructs were processed 72 hr after injection for Islet-1/2 immunostaining in either dissociated whole retina cells (A) or cryosections (B). In A, the results correspond to the mean ± SD value of the percentage of labeled cells (500 total cells were counted in duplicate for each of 3 infected embryos per viral construct). In B, the results shown are the percentages of labeled cells in the different retinal layers (4 sections of 3 infected embryos per viral stock were counted, and the scores of fields such as that presented in Fig.4I were added). GCL, Ganglion cell layer; INL, prospective inner nuclear layer.
Fig. 6.
Fig. 6.
Phenotypic effect of the interference with Raf in the optic fiber layer. Retinas infected at E4.5 with RCAS (A, D), RCAS/C-Raf (B, E), or RCAS/ΔRaf (C, F) were processed 72 hr after injection as whole mounts for double immunostaining of the axonal protein G4/Ng-CAM (A–C) and the viral protein Gag19 (D–F). Optic sections were obtained every 0.5 μm, spreading the entire thickness of the optic fiber layer and combined to reconstruct the whole layer. In the same field, an optic section in the middle of the ganglion cell layer was obtained to assess the viral infection. Comparative fields in the temporoventral quadrant are shown for the different experimental cases.

Similar articles

Cited by

References

    1. Alexiades MR, Cepko CL. Subsets of retinal progenitor display temporally regulated and distinct biases in the fates of their progeny. Development. 1997;124:1119–1131. - PubMed
    1. Altshuler DM, Turner DL, Cepko C. Specification of cell type in the vertebrate retina. In: Lau DM, Shatz CJ, editors. Development of the visual system. MIT; Cambridge, MA: 1991. pp. 37–58.
    1. Austin CP, Feldman DE, Ida JA, Cepko C. Vertebrate retinal ganglion cells are selected from competent progenitors by action of Notch. Development. 1995;121:3637–3650. - PubMed
    1. Barde Y-A. Trophic factors and neuronal survival. Neuron. 1989;2:1525–1534. - PubMed
    1. Blaschke AJ, Staley K, Chun J. Widespread programmed cell death in proliferative and postmitotic regions of the fetal cortex. Development. 1996;122:1165–1174. - PubMed

Publication types

Substances