. 2000 May 1;20(9):3263-81.
doi: 10.1523/JNEUROSCI.20-09-03263.2000.

Laminar distribution of neurons in extrastriate areas projecting to visual areas V1 and V4 correlates with the hierarchical rank and indicates the operation of a distance rule

Affiliations

Laminar distribution of neurons in extrastriate areas projecting to visual areas V1 and V4 correlates with the hierarchical rank and indicates the operation of a distance rule

P Barone et al. J Neurosci. .

Abstract

The directionality of corticocortical projections is classified as feedforward (going from a lower to higher hierarchical levels), feedback (interconnecting descending levels), and lateral (interconnecting equivalent levels). Directionality is determined by the combined criteria of the laminar patterns of the axon terminals as well as the cells of origins and has been used to construct models of the visual system, which reveals a strict hierarchical organization (Felleman and Van Essen, 1991; Hilgetag et al., 1996a). However, these models are indeterminate partly because we have no indication of the distance separating adjacent levels. Here we have attempted to determine a graded parameter describing the anatomical relationship of interconnected areas. We have investigated whether the precise percentage of labeled supragranular layer neurons (SLN%) in each afferent area after injection in either visual areas V1 or V4 determines its hierarchical position in the model. This shows that pathway directionality in the Felleman and Van Essen model is characterized by a range of SLN% values. The one exception is the projection of the frontal eye field to area V4, which resembles a feedforward projection. Individual areal differences in SLN% values are highly significant, and the number of hierarchical steps separating a target area from a source area is found to be tightly correlated to SLN%. The present results show that the hierarchical rank of each afferent area is reliably indicated by SLN%, and therefore this constitutes a graded parameter that is related to hierarchical distance.


Figures

Fig. 1.
Fig. 1.
A–C, Analysis of a projection zone in area V2 after injection in area V1. A,Two-dimensional reconstruction of the projection zone. Area V1–V2 border is to the left (arrow), and fundus of the lunate sulcus is to the right. B, Density profile in the dorsoventral direction, showing the number of neurons counted at regular intervals on parasagittal sections. Counts are aligned on the V1–V2 border indicated by an arrow(0 on the x-axis, 12 is toward the fundus of the LS). C, Density profile in the lateromedial direction showing numbers of labeled neurons per section.0 is an arbitrary start point that corresponds to absence of labeling. D, E, Projecting zone in area MT after an injection in area V4. D,Density profile of the labeled neurons in supragranular and infragranular layers. The SLN% values are indicated and show that on individual sections SLN% values can range in the center of the projection zone from 16–36%. E shows the effects of 10 and 20% of maximum neuron thresholds on the dimensions of the projection zone (PZ). When these thresholds are applied, the size of the projections zone is reduced by 22 and 39%, respectively, whereas the SLN values change for <0.3%.
Fig. 2.
Fig. 2.
Horizontal sections showing the location of labeling in the extrastriate and frontal areas examined in this study. All cortical areas but one (V3A) that project to area V4 also project to area V1. MT, Middle temporal area;TEO, temporal occipital area; TE, temporal area; FST, fundus superior temporal area;LIP, lateral intraparietal area; FEF, frontal eye field; LS, lunate sulcus;POS, posterior occipital sulcus; STS, superior temporal sulcus; IOS, inferior occipital sulcus; AS, arcuate sulcus; LatS, lateral sulcus; CeS, central sulcus; PS, principal sulcus; IPS, intraparietal sulcus;CaS, calcarine sulcus.
Fig. 3.
Fig. 3.
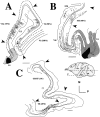
Laminar pattern of retrogradely labeled cells in adjacent cortical areas projecting to V4. A, The labeling in area V3A in the anterior bank of the LS can be distinguished from the labeling in V2 in the posterior bank of the LS by an increase of density in infragranular layers. Labeling in V3A is separate from the labeling in V2 because V3 shows weak or no projection to area V4. Labeling is isolated from the intrinsic labeling in V4 (indicated in gray) surrounding the injection sites (shown in black). Very few labeled cells are observed in area V1. B, Despite the fact that V4t and V5 share a border with a central field representation, labeling in these two areas was largely discontinuous as shown in this example (see Results).C, Discontinuity of labeling between the areas TE and TH–TF. Individual values of SLN% calculated in regions delimited byarrows are indicated. Scale bars, 1 mm.
Fig. 4.
Fig. 4.
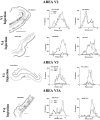
Distribution of retrogradely labeled neurons in extrastriate areas V2, V3, and V3A. Left-hand column, Plots of retrogradely labeled neurons taken from the center of the projection zone as determined from density profiles.Middle and right-hand columns, Neuron density profiles. Plots and neuron density profiles have been chosen from different animals. Scale bars, 1 mm.
Fig. 5.
Fig. 5.
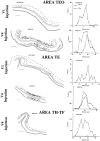
Distribution of retrogradely labeled neurons in ventral stream areas (TEO, TE, and TH–TF). Conventions as in Figure4.
Fig. 6.
Fig. 6.
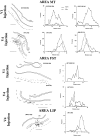
Distribution of retrogradely labeled neurons in dorsal stream areas (MT, FST, and LIP). Conventions as in Figure4.
Fig. 7.
Fig. 7.
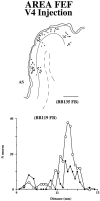
Distribution of retrogradely labeled neurons in FEF. Conventions as in Figure 4.
Fig. 8.
Fig. 8.
Distribution of retrogradely labeled neurons in areas V4 and V1. The V1–V2 border is indicated by anarrowhead. Conventions as in Figure 4.
Fig. 9.
Fig. 9.
Distribution of retrogradely labeled intrinsic neurons. Scale bar, 0.5 mm. Conventions as in Figure 4.
Fig. 10.
Fig. 10.
Histograms of the mean SLN% values in individual cortical areas that project to areas V1 (A) and V4 (B). In each case, FB (gray bars), FF (white bars), and intrinsic projections (black bars) are distinguished.
Fig. 11.
Fig. 11.
A,Felleman and Van Essen (1991)hierarchical model of the visual system. B, Table indicating the number of levels separating individual areas from areas V1 and V4. C, Correlation of SLN% with the numbers of hierarchical levels calculated from the model of Felleman and Van Essen (1991). Crosses correspond to intrinsic values.Arrowhead points toward the SLN% value observed for the FEF to V4 projection.
Fig. 12.
Fig. 12.
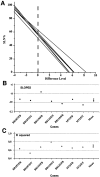
A, Correlation for single injections in area V4 of SLN% with the number of hierarchical levels that separate individual afferent areas. Slopes (B) and r2(C) calculated from the individual correlograms shown in A.
Fig. 13.
Fig. 13.
Hierarchical model obtained after paired comparison (Table 2) of the proportion of supragranular projecting cells in V1 and V4 afferents. Conventions as in Figure 11.

References

    1. Ahmed B, Anderson JC, Douglas RJ, Martin KA, Whitteridge D. Estimates of the net excitatory currents evoked by visual stimulation of identified neurons in cat visual cortex. Cereb Cortex. 1998;8:462–476. - PubMed
    1. Amaral DG, Insausti R, Cowan WM. The entorhinal cortex of the monkey: I. Cytoarchitectonic organization. J Comp Neurol. 1987;264:326–355. - PubMed
    1. Andersen RA, Asanuma C, Essick G, Siegel RM. Corticocortical connections of anatomically and physiologically defined subdivisions within the inferior parietal lobule. J Comp Neurol. 1990;296:65–113. - PubMed
    1. Baizer JS, Ungerleider LG, Desimone R. Organization of visual inputs to the inferior temporal and posterior parietal cortex in macaques. J Neurosci. 1991;11:168–190. - PMC - PubMed
    1. Baleydier C, Morel A. Segregated thalamocortical pathways to inferior parietal and inferotemporal cortex in macaque monkey. Vis Neurosci. 1992;8:391–405. - PubMed

Publication types

LinkOut - more resources