. 2000 May 1;20(9):3354-68.
doi: 10.1523/JNEUROSCI.20-09-03354.2000.

Novel hippocampal interneuronal subtypes identified using transgenic mice that express green fluorescent protein in GABAergic interneurons

Affiliations

Novel hippocampal interneuronal subtypes identified using transgenic mice that express green fluorescent protein in GABAergic interneurons

A A Oliva Jr et al. J Neurosci. .

Abstract

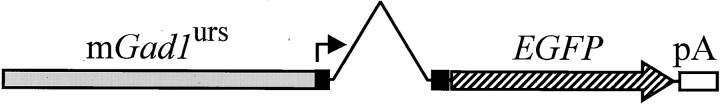
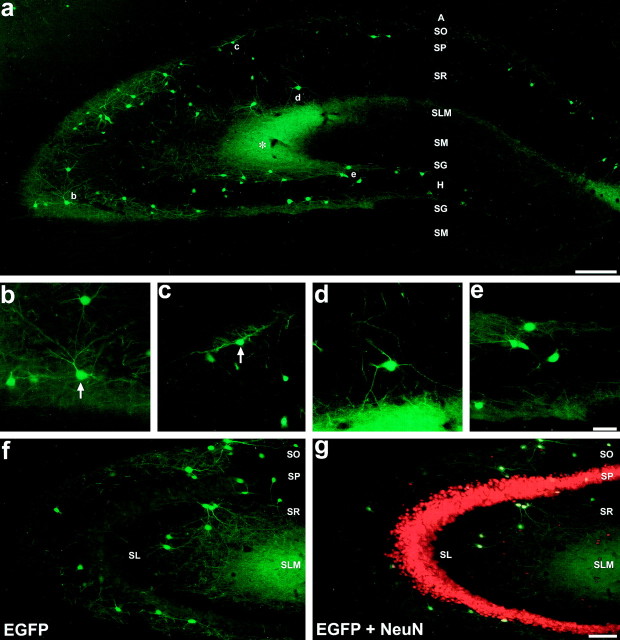
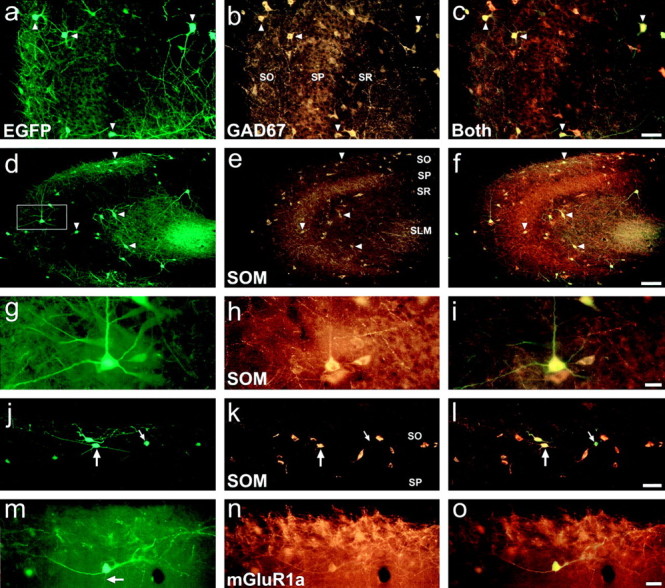
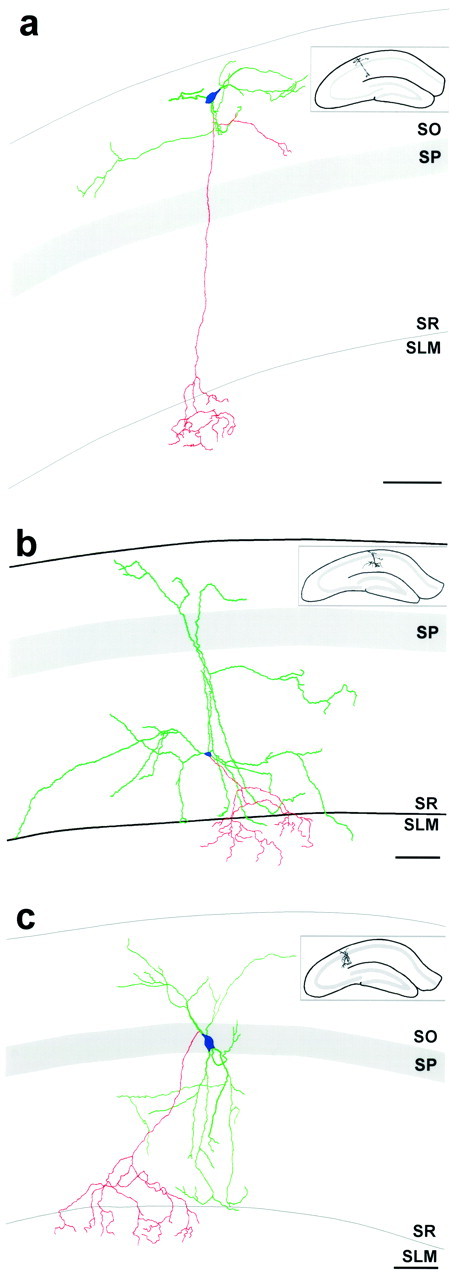
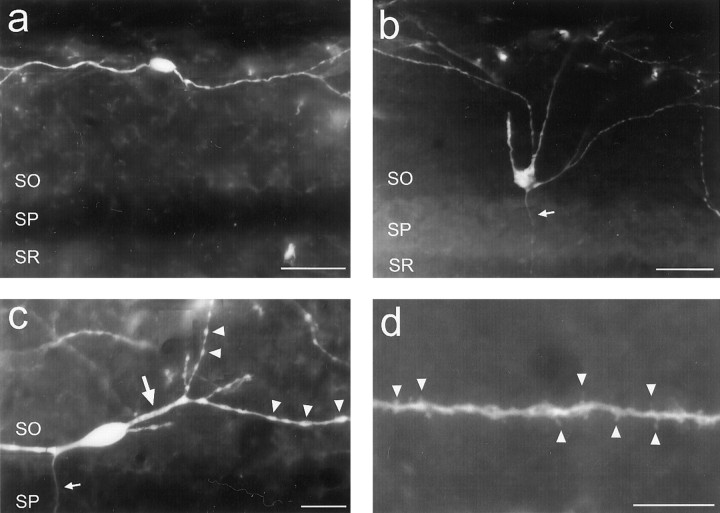
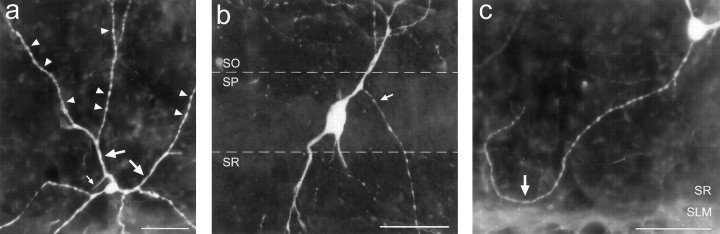
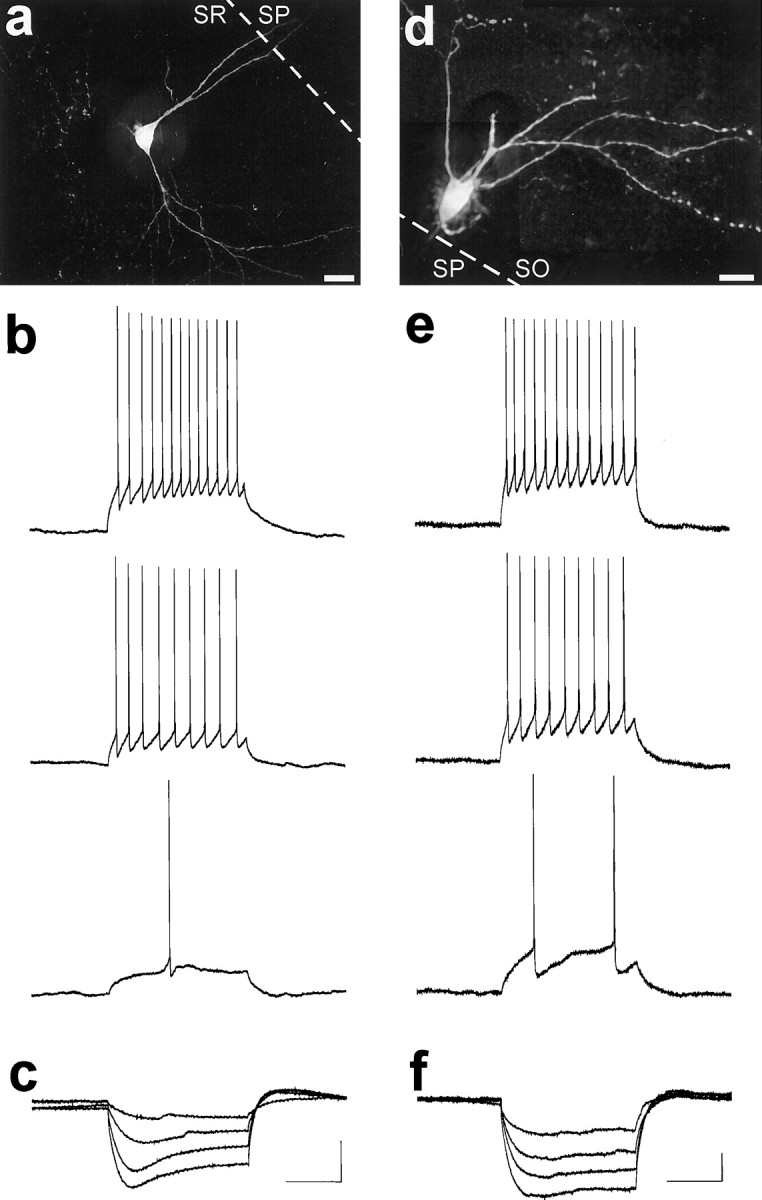
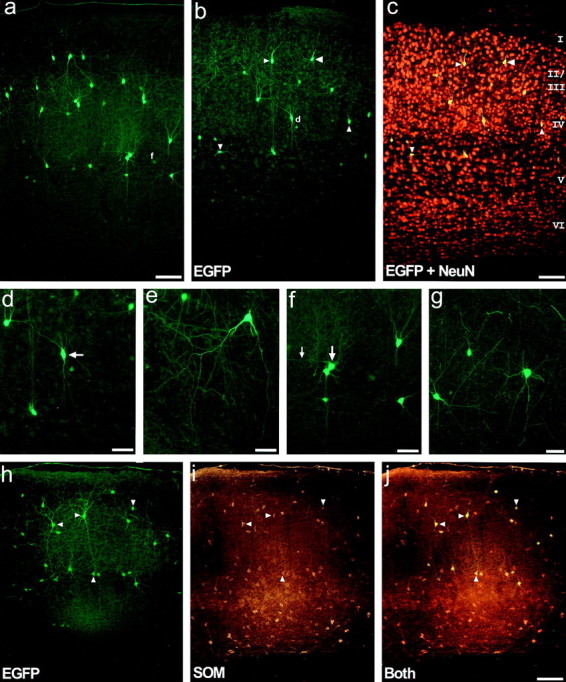
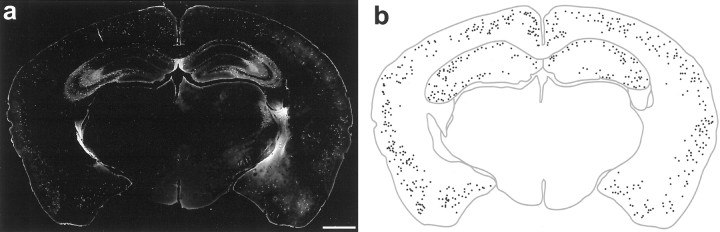
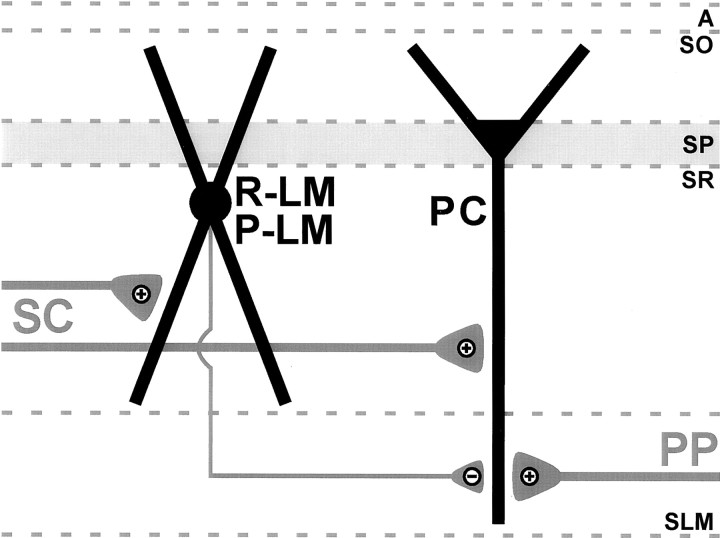
The chief inhibitory neurons of the mammalian brain, GABAergic neurons, are comprised of a myriad of diverse neuronal subtypes. To facilitate the study of these neurons, transgenic mice were generated that express enhanced green fluorescent protein (EGFP) in subpopulations of GABAergic neurons. In one of the resulting transgenic lines, called GIN (GFP-expressing Inhibitory Neurons), EGFP was found to be expressed in a subpopulation of somatostatin-containing GABAergic interneurons in the hippocampus and neocortex. In both live and fixed brain preparations from these mice, detailed microanatomical features of EGFP-expressing interneurons were readily observed. In stratum oriens of the hippocampus, EGFP-expressing interneurons were comprised almost exclusively of oriens/alveus interneurons with lacunosum-moleculare axon arborization (O-LM cells). In the neocortex, the somata of EGFP-expressing interneurons were largely restricted to layers II-IV and upper layer V. In hippocampal area CA1, two previously uncharacterized subtypes of interneurons were identified using the GIN mice: stratum pyramidale interneurons with lacunosum-moleculare axon arborization (P-LM cells) and stratum radiatum interneurons with lacunosum-moleculare axon arborization (R-LM cells). These newly identified interneuronal subtypes appeared to be closely related to O-LM cell, as they selectively innervate stratum lacunosum-moleculare. Whole-cell patch-clamp recordings revealed that these cells were fast-spiking and showed virtually no spike frequency accommodation. The microanatomical features of these cells suggest that they function primarily as "input-biasing" neurons, in that synaptic volleys in stratum radiatum would lead to their activation, which in turn would result in selective suppression of excitatory input from the entorhinal cortex onto CA1 pyramidal cells.


Figures

Fig. 1.
Fig. 1.
Transgene used for the creation of the GIN mice. Approximately 2.8 kbp of murine Gad1 gene sequence was subcloned upstream to the coding sequence for EGFP. The portion of theGad1 gene used consisted of ∼1.2 kbp of upstream regulatory sequence (mGad1urs;gray box) 5′ to the major transcription start site (arrow), the entire first (and noncoding) exon (black box) and intron (inverted “V”), and part of the second exon (black box) 5′ to the Gad1 translation start site. Thus, the transgene does not encode an EGFP fusion protein product. EGFP coding region, Large striped arrow. SV40 polyadenylation site; White box.
Fig. 2.
Fig. 2.
EGFP expression pattern in the hippocampus of GIN mice. a, Montage exemplifying the EGFP expression pattern in the adult dorsal hippocampus, created from overlapping photomicrographs of a 50-μm-thick section from an homozygotic mouse.Asterisk denotes the plexus of EGFP-expressing axonal terminals in SLM of area CA3. bd, Higher magnification images of the areas denoted by the respective letters in a. b, Cells in SO of area CA3.c, Cells from SO of area CA1, one of which shows classical O-LM cell-type morphology (arrow).d, Cell from SR of area CA1 with long tapering dendrites. e, EGFP-expressing cells in the hilus of the dentate gyrus near the hilar-CA3 border. f, g, EGFP expression in area CA3 of the adult hippocampus from a section immunohistochemically processed for the neuron-specific nuclear protein NeuN. f, Visualization of EGFP expression alone.g, Simultaneous visualization of EGFP and NeuN expression using a double filter set. All EGFP-expressing cells coexpressed NeuN, as indicated by the bright yellownuclei at the centers of their somata. It should be noted that the NeuN signal shows some bleedthrough when viewing with the GFP filter set (compare SP from a with f). Strata abbreviations: A, alveus; SO, stratum oriens; SP, stratum pyramidale; SR, stratum radiatum; SLM, stratum lacunosum-moleculare;SM, stratum moleculare; SG, stratum granulosum; H, hilus of the dentate gyrus;SL, stratum lucidum. Scale bars: a, 200 μm; e, 50 μm (used forb–e); g, 100 μm (used for f and g).
Fig. 3.
Fig. 3.
Immunohistochemical characterization of EGFP-expressing cells in the hippocampus of GIN adult mice.ac, EGFP-expressing cells coexpress GAD67. a, EGFP expression in area CA3. b, GAD67 expression in the same section as in a. c, Same section as a and b in which EGFP and GAD67 expression were simultaneously viewed using a double-filter set. Note that every EGFP-expressing cell coexpressed GAD67 and that coexpression of the two proteins appears yellow in color using the double filter set. di, EGFP-expressing interneurons coexpress somatostatin. d, EGFP expression in area CA3. e, SOM expression in the same section as in d. f, EGFP and SOM expression simultaneously viewed using a double-filter set. Note that every EGFP-expressing interneuron coexpressed SOM.gi, Higher magnification views of the neuron denoted by the box in d. This neuron had a morphology consistent with that of a CA3 O-LM cell.jl, EGFP and SOM expression in SO of area CA1. j, EGFP-expressing interneurons of SO are SOM-positive and show morphological features characteristic of area CA1 O-LM cells (large arrow). Small arrowdenotes an EGFP-expressing somata that was very weakly immunopositive for SOM. mo, EGFP-expressing interneurons coexpress mGluR1a. m, An EGFP-expressing O-LM cell in SO of area CA1. n, mGluR1a expression in the neuron of m. o, Simultaneous visualization of EGFP and mGluR1a expression. Notice the initial segment of the axon from this neuron (m, arrow) that was negative for mGluR1a expression. Whereas only its initial segment resided in the focal plane of the photomicrographs, this axon could be followed through SP and SR to SLM, where it ramified; this process was negative for mGluR1a expression over its entire length. Strata abbreviations are the same as in Figure 2. Arrowheads in panelsa–f denote the same cells for each image set. Scale bars: c,l, 50 μm;f, 100 μm; i, o, 20 μm.
Fig. 4.
Fig. 4.
Neurolucida reconstructions of EGFP-expressing O-LM, R-LM, and P-LM cells, illustrating their complete in vivo dendritic structures and axonal innervation patterns. Reconstructions were performed on serial brain sections that were immunohistochemically processed for EGFP using DAB-based immunohistochemistry. Dendrites are green, axons arered, and somata are blue.a, Reconstruction of an O-LM cell. This cell had dendrites restricted to SO and gave rise to an axon that traversed mainly unbifurcated to SLM, where it ramified. Note that this cell gave rise to local axonal collaterals in SO. The fully reconstructed dendritic tree of this O-LM cell extended ∼350 μm in the septotemporal axis and ∼450 μm in the mediolateral direction. b, Reconstruction of an R-LM cell. This cell had its somata in SR and gave rise to an axon that ramified significantly in SLM. This interneuronal subtype had dendrites that spanned from SO to SR, but rarely entered SLM. Note that one of the dendritic processes appears to deeply penetrate SLM; this is a misrepresentation attributable to the flattening of the three-dimensional reconstruction into two dimensions, in which laminar borders cannot properly be preserved. The dendritic tree of this R-LM cell extended ∼400 μm in the septotemporal axis and ∼850 μm in the mediolateral direction. c, Reconstruction of a P-LM cell. This cell had its somata in SP and gave rise to an axon that ramified in SLM. As was the case for R-LM cells, this interneuronal subtype had dendrites that spanned from SO to SR and that tended to avoid all but the most proximal portion of SLM. The dendritic tree of this P-LM cell extended ∼350 μm in the septotemporal axis and ∼400 μm in the mediolateral direction. All reconstructions were from adult GIN mice. Note that only partial axonal reconstructions were possible: axons could only be followed for short distances after entering SLM because they became obscured by the high density of other EGFP-expressing axonal processes. Insets show the hippocampal location of each reconstructed interneuron. Strata abbreviations are the same as in Figure 2. Scale bars:a–c, 100 μm.
Fig. 5.
Fig. 5.
O-LM cell morphological features.a, An O-LM cell with its somata located close to the alveus. Typical of O-LM cells located at this portion of the strata, this interneuron had an oval-shaped somata and horizontally running dendrites. b, Typical example of an O-LM cell with its somata located close to SP. Such O-LM cells gave rise to primary dendrites that would initially project radially toward the alveus, but after entering the distal portion of SO, would turn to project horizontally, running parallel to the layer borders. Note that the initial axonal segment of this cell can be seen (arrow) traversing through SP. c,d, High magnification images illustrating the fine dendritic features typical of O-LM cells. c, As was common for O-LM cell, the primary dendrites (large arrow) were usually large and smooth. Starting at the secondary branches, the dendrites usually became much thinner and bore numerous varicosities (arrowheads). Such morphology would persist throughout the remainder of the dendritic tree. d, Many, but not all, O-LM cells were sparsely to moderately spiny. Generally, spines (arrowheads) were only found at the most distal dendritic segments of O-LM cells, often on terminal branches, as was the case here. The axonal initial segment can be seen inc (small arrow). Strata abbreviations are the same as in Figure 2. Scale bars: a,b, 40 μm; c, 20 μm; d, 10 μm.
Fig. 6.
Fig. 6.
R-LM and P-LM cell morphological features.a, R-LM cell. As was typical of this interneuronal subtype, this R-LM cell had a pyramidal-shaped somata from which three primary dendrites emanated. This cell also had relatively smooth primary dendrites (large arrows), which then became quite varicose after the first dendritic branchings (arrowheads). The axon initial segment can also be seen emanating from a primary dendrite (small arrow).b, P-LM cell. Note the axon that emanated from the primary dendrite, which projected toward SLM. c, R-LM and P-LM cell dendrites generally do not enter SLM. This example shows an R-LM cell dendrite that abruptly turned away from SLM at the SR-SLM border. In this case, the dendrite did not enter SLM. In numerous other cases, the dendrites would enter the most proximal portion of SLM before turning back. For all three images, SO is above, and SLM is below. Strata abbreviations are the same as in Figure 2. Scale bars:a–c, 40 μm.
Fig. 7.
Fig. 7.
Neurophysiological properties of visually identified hippocampal EGFP-expressing interneurons. a, Maximum projection image of a deconvolved image set taken of an R-LM cell, revealing the extensive dendritic arborization of this interneuron. The image set consisted of 50 images taken at 1.0 μmz-axis spacing. Deconvolution was performed for 100 iterations, and a maximum projection image was generated as shown.b, Response of the R-LM cell of a to depolarizing current injections (0.05–0.15 nA, 0.05 nA increments). Trains of action potentials were elicited in response to square wave depolarizing current steps that increased in frequency as the depolarizations increased. As was typical for EGFP-expressing interneurons, this neuron showed little, if any, spike frequency adaptation (accommodation). c, R-LM cell response to square-wave hyperpolarizing current injections (−0.20 to −0.05 nA, 0.05 nA increments). Note the time-dependent inward rectification (depolarizing “sag”) typical of this interneuronal cell type.d, Postrecording deconvolution of an image set for an O-LM cell. The image set consisted of 70 images taken at 1.0 μmz-axis spacing. Deconvolution was performed for 100 iterations on subsections of the image, from which maximum projection images were generated and subsequently montaged together to generate the completed image. e, Trains of action potentials were elicited in EGFP-expressing O-LM cell in response to square wave depolarizing current steps (0.03–0.09 nA, 0.03 nA increments). EGFP-expressing O-LM cells showed little, if any, accommodation.f, O-LM cell response to hyperpolarizing current steps (−0.12 to −0.03 nA, 0.03nA increments). In response to hyperpolarizing current steps, O-LM cells typically exhibited a depolarizing “sag”. Scale bars: a, 20 μm;d, 40 μm. Input resistance: b, 150 MΩ; c, 300 MΩ; e, f, 550 MΩ. Resting membrane potential: b, −69 mV;c, −67 mV; e, f, −59 mV. Calibration: 200 msec, 20 mV (shown in c forb, c; e fore, f). All recordings were performed at room temperature.
Fig. 8.
Fig. 8.
Characterization of EGFP-expressing cells in the neocortex of adult GIN mice. a, Photomicrograph illustrating the pattern of EGFP in barrel field cortex. This expression pattern typifies that as seen in all neocortical areas.b,c, Laminar specificity of EGFP expression demonstrated in primary somatosensory cortex from a 30-μm-thick section immunohistochemically processed for the neuron-specific nuclear protein NeuN. Visualization of EGFP expression alone (b) or simultaneous visualization of EGFP and NeuN expression (c) using a double filter set. EGFP-expressing somata are restricted mainly to layers II-IV and upper layer V. Note that the EGFP-expressing neurons appear completelyyellow, rather than just their nuclei, as a consequence of the high density of surrounding NeuN signal during photomicrography (compare to Fig. 2g). Also note that the NeuN signal shows bleedthrough using the EGFP filter (compare a, not processed for NeuN, withb.) d, Higher magnification view of the area denoted by the small d in panel b. The cell denoted by the arrow had a radial bipolar morphology that was common for many neocortical EGFP-expressing interneurons. e, High magnification view of an EGFP-expressing interneuron from the auditory cortex, exemplifying another subtype of EGFP-expressing interneuron. Interneurons of this subtype have a pyramidal shaped somata localized to upper layer II, with two prominent descending primary dendrites that drape down into layer III, but no prominent ascending dendrites. Another cell of this subtype is found in the upper left side of panel a. f, Higher magnification view of the area denoted by the smallf in panel a. The somata denoted by thelarge arrow had a prominent horizontally running dendrite (small arrow), and exemplifies a third subtype of neocortical EGFP-expressing interneuron. g, EGFP-expressing interneurons from the piriform cortex further illustrate the diversity of morphologies found. h–j, Neocortical EGFP-expressing interneurons coexpress somatostatin.h, EGFP expression in the secondary visual cortex.i, SOM expression in the same section as in panelh. i, Simultaneous visualization of EGFP and SOM expression using a double filter set. Note that every EGFP-expressing interneuron coexpressed SOM. All photomicrographs are oriented such that layer I is above and layer VI below, and the laminar borders are essentially parallel to the top of the page. Layers are denoted byroman numerals. Arrowheads inb,c and h–j denote the same cells for each image set. Scale bars: a, c, j, 100 μm;d–g, 50 μm.
Fig. 9.
Fig. 9.
EGFP expression in a coronal section of an adult GIN mouse brain. a, Fifty-micrometer-thick section immunohistochemically processed for EGFP. Note that the image is digitally inverted to enhance contrast. b, Trace of the brain section in panel a, in which EGFP-expressing somata are shown as black dots. Note the relatively uniform distribution of EGFP-expressing neurons among the different areas of the neocortex and the complete lack of expression in the midbrain. Scale bar, 1 mm.
Fig. 10.
Fig. 10.
Proposed model of feedforward inhibition involving R-LM and P-LM cells. Schaffer collaterals (SC) simultaneously excite R-LM and P-LM cells, as well as CA1 pyramidal cells (PC). Excitation of R-LM and P-LM cells then results in inhibition occurring at pyramidal cell distal dendrites in SLM. The effect of this inhibition is to selectively sequester information flow from the entorhinal cortex to CA1 by attenuating perforant pathway (PP) synapses on CA1 pyramidal cell distal dendrites. Thus in this model, R-LM and P-LM cells promote and isolate information flow from CA3 to CA1, and thereby act as “input-biasing” interneurons.

Similar articles

Cited by

References

    1. Alcántara S, Ruiz M, D'Arcangelo G, Ezan F, de Lecea L, Curran T, Sotelo C, Soriano E. Regional and cellular patterns of reelin mRNA expression in the forebrain of the developing and adult mouse. J Neurosci. 1998;18:7779–7799. - PMC - PubMed
    1. Alonso A, Köhler C. Evidence for separate projections of hippocampal pyramidal and non-pyramidal neurons to different parts of the septum in the rat brain. Neurosci Lett. 1982;31:209–214. - PubMed
    1. Baude A, Nusser Z, Roberts JD, Mulvihill E, McIlhinney RA, Somogyi P. The metabotropic glutamate receptor (mGluR1α) is concentrated at perisynaptic membrane of neuronal subpopulations as detected by immunogold reaction. Neuron. 1993;11:771–787. - PubMed
    1. Bergmann I, Nitsch R, Frotscher M. Area-specific morphological and neurochemical maturation of non-pyramidal neurons in the rat hippocampus as revealed by parvalbumin immunocytochemistry. Anat Embryol (Berl) 1991;184:403–404. - PubMed
    1. Bissette G. Neuropeptides and Alzheimer's disease pathology. Ann NY Acad Sci. 1997;814:17–29. - PubMed

Publication types

LinkOut - more resources