. 2000 May 1;20(9):3449-55.
doi: 10.1523/JNEUROSCI.20-09-03449.2000.

Extraretinal control of saccadic suppression

Affiliations

Extraretinal control of saccadic suppression

M R Diamond et al. J Neurosci. .

Abstract

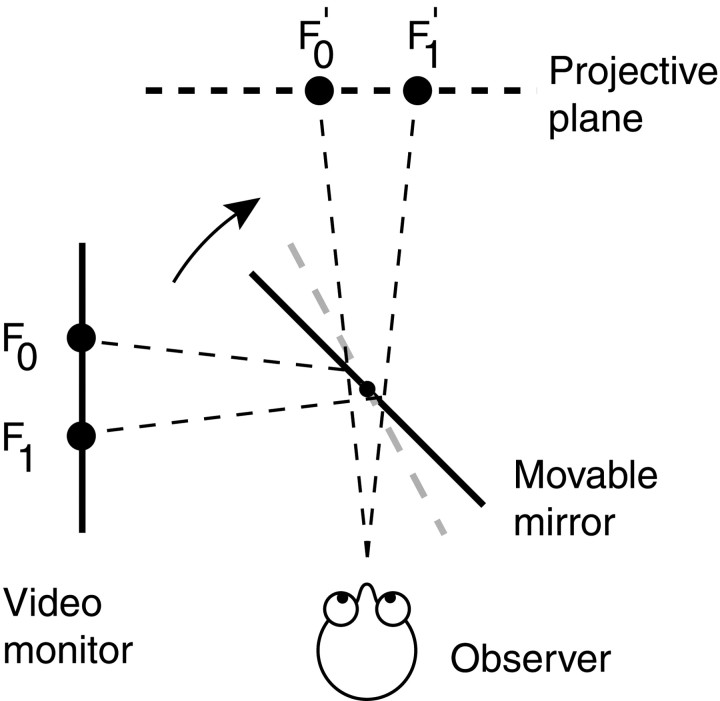
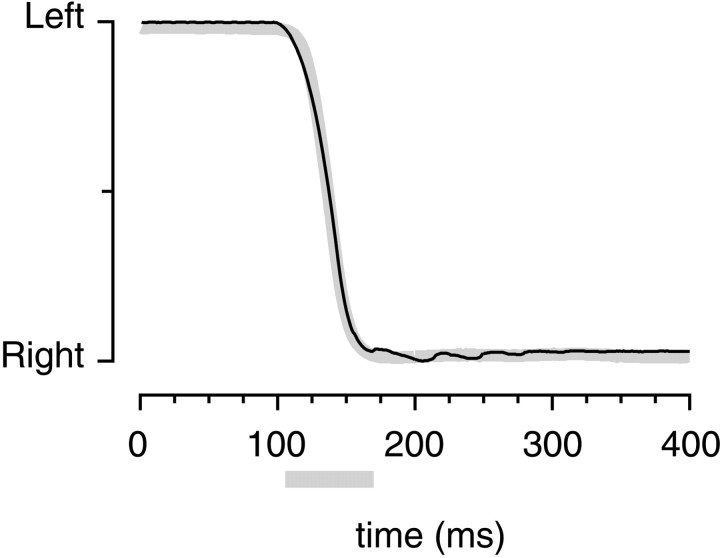
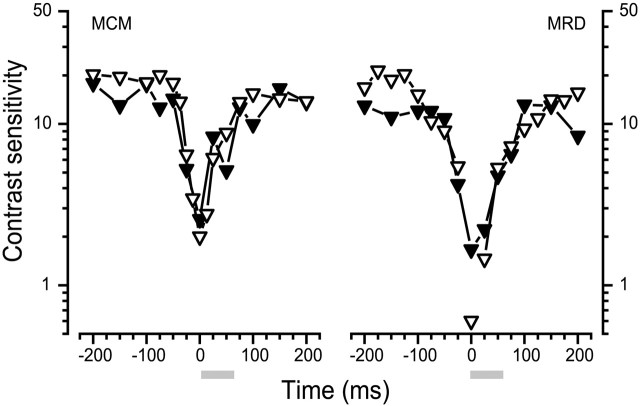
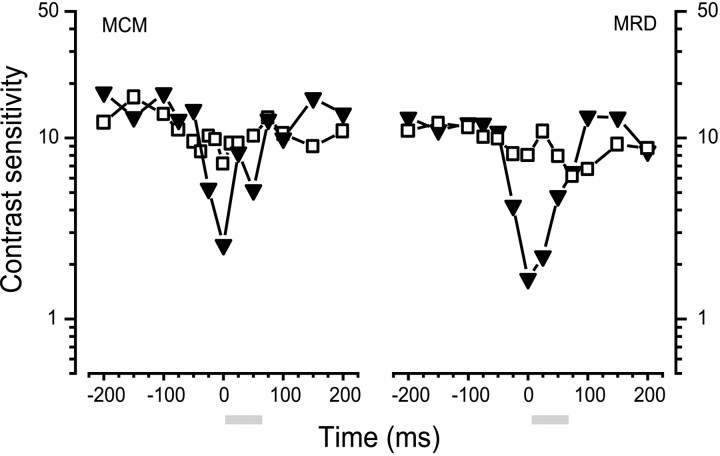
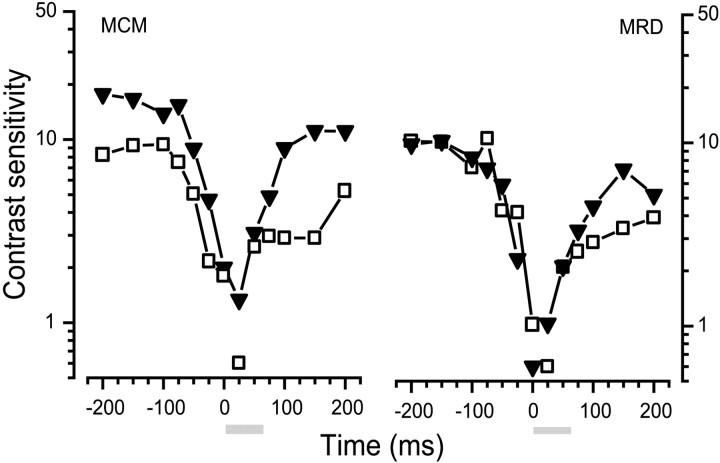
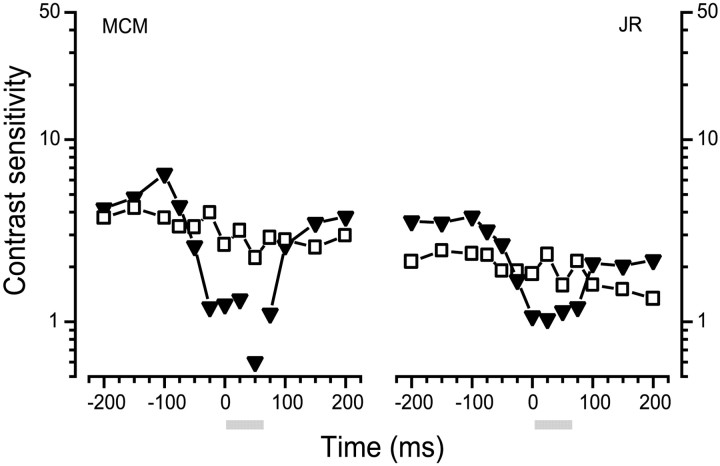
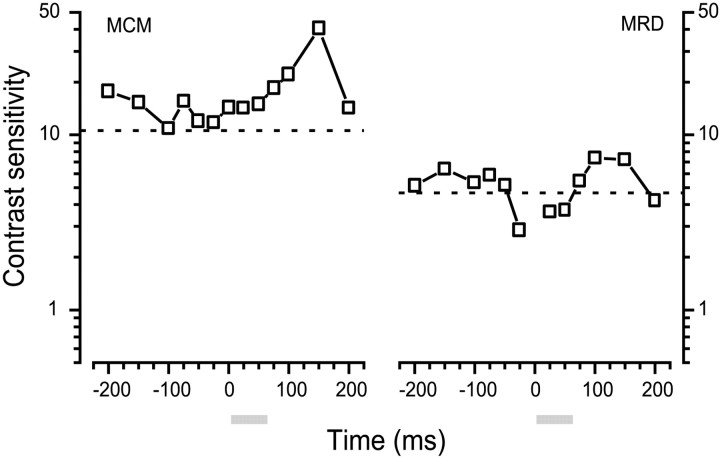
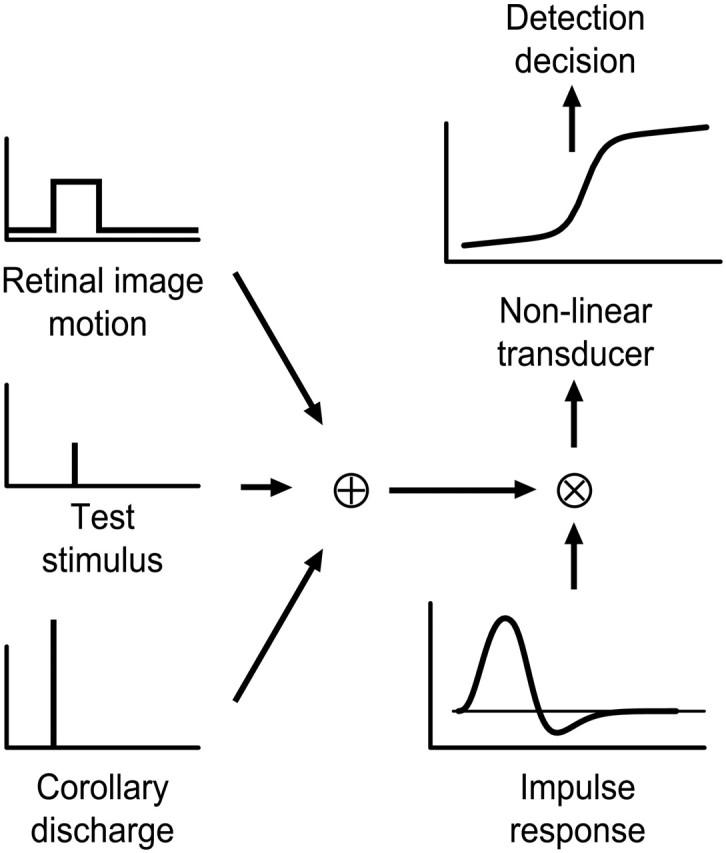
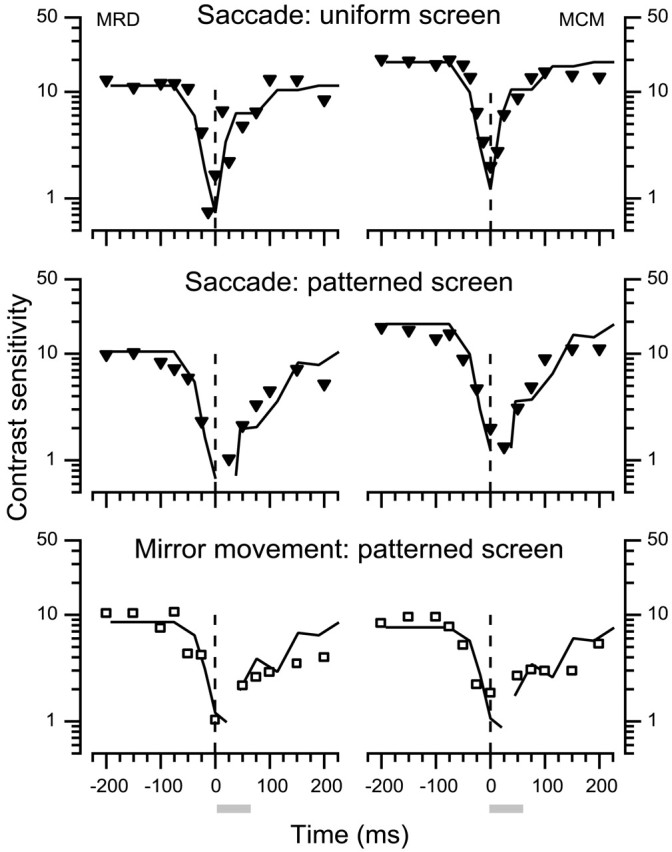
We measured the time course of saccadic suppression and tested whether suppression results entirely from retinal image motion or has an extraretinal source. We measured contrast thresholds for low-frequency gratings modulated either in luminance, at 17 cd/m(2) and 0.17 cd/m(2), or color at 17 cd/m(2). Gratings were flashed on a uniform background before, during, or after voluntary 12 degrees saccades and, additionally in the case of luminance modulated gratings, saccades simulated by mirror motion. A 10-fold decrease in contrast sensitivity was found for luminance-modulated gratings with saccades, but little suppression was found with simulated saccades. Adding high-contrast noise to the display increased the magnitude and the duration of the suppression during simulated saccades but had little effect on suppression produced by real saccades. Suppression anticipates saccades by 50 msec, is maximal at the moment of saccadic onset, and outlasts saccades by approximately 50 msec. At lower luminance, suppression is reduced, and its course is shallower than at higher luminance. Simulated saccades produce shallower suppression over a longer time course at both luminances. No suppression was found for chromatically modulated gratings. Differences between real and simulated saccades in the magnitude and time course of sensitivity loss suggest that saccadic suppression has an extraretinal component. We model the effects of saccades by adding a signal to the visual input, so as to saturate the nonlinear stage of visual processing and make detection of a test stimulus more difficult.


Figures

Fig. 1.
Fig. 1.
Viewing arrangement. In all but the first experiment (see Materials and Methods) observers viewed an image of the screen at an effective distance of 50 cm. In conditions requiring simulated saccades, the mirror was rotated around its center to the position shown in gray.F0 represents the observer's initial fixation; F1 represents the saccadic target. The projective images of these points are shown asF0′ and F1′.
Fig. 2.
Fig. 2.
Traces, obtained from a scleral-limbus tracker, of the motion of a saccading eye (thick gray line) and an artificial eye mounted on a rotating mirror (black line). The traces overlap for most of their course but show that the deceleration of the mirror is not quite as smooth as that of the eye. The horizontal gray bar indicates the duration of image motion.
Fig. 3.
Fig. 3.
Contrast sensitivity under conditions in which the video screen was viewed directly (open triangles) or in a mirror (solid triangles). The horizontal gray bars indicate the duration of image motion; sensitivity values <1 indicate indeterminate thresholds. Error estimates calculated using leave-one-out resampling (Weiss and Kulikowski, 1991) are smaller than symbol size.
Fig. 4.
Fig. 4.
Contrast sensitivity during saccades (solid triangles) and during image motion caused by mirror rotation (open squares) in which the task was to identify the brightness polarity of the midline of a flashed grating. Contrast sensitivity during saccades drops by ∼1 log unit and reaches a minimum at the time of onset of the saccade (t = 0). Changes in contrast sensitivity caused by the movement of the image alone are comparatively small. The horizontal gray barsindicate the duration of image motion.
Fig. 5.
Fig. 5.
Contrast sensitivity during saccades (solid triangles) and during image motion caused by mirror rotation (open squares) where the task was to detect a grating flashed against a highly patterned background. Contrast sensitivity changes during saccades are almost identical with those shown in Figure4. Changes in contrast sensitivity caused by the movement of the image alone follow a more extended time course of recovery to baseline. From approximately +75 msec, contrast sensitivity after saccades exceeds that after mirror motion. The horizontal gray barsindicate the duration of image motion; sensitivity values <1 indicate indeterminate thresholds.
Fig. 6.
Fig. 6.
Contrast sensitivity at low luminance (0.17 cd/m2) during saccades (solid triangles) and during image motion caused by mirror rotation (open squares). For MCM, the task was to identify the contrast polarity of a flashed grating, for JR it was to detect the grating. The saccade is associated with a loss in contrast sensitivity of ∼0.5 log units, whereas there is virtually no loss in sensitivity associated with mirror motion. The horizontal gray bars indicate the duration of image motion; sensitivity values <1 indicate indeterminate thresholds.
Fig. 7.
Fig. 7.
Contrast sensitivity during saccades for gratings modulated in color (red–green) at equiluminance. The dotted line represents contrast sensitivity in the absence of saccades or mirror motion. For both observers, there was some suggestion of presaccadic enhancement of sensitivity and no sign of the strong saccadic suppression found with stimuli modulated in luminance. The sharp peak in sensitivity for MCM at 150 msec is very similar to that reported in Burr et al. (1994). The horizontal gray barsindicate the duration of image motion.
Fig. 8.
Fig. 8.
A model of saccadic suppression. The contrast change resulting from retinal image motion is added to that resulting from the presentation of the test stimulus. When saccades are made, a corollary discharge is also added to the early input. The input is convolved with the impulse response function of the visual system, and the output of the convolution is in turn passed through a nonlinear transducer. The output of the transducer serves as the basis for a decision about the presence or absence of the test stimulus (see “Model”).
Fig. 9.
Fig. 9.
Fit of the model to the experimental data for saccades with a uniform screen (a), saccades with a patterned screen (b), and mirror motion with a patterned screen (c). Solid triangles indicate data points for saccadic conditions,opensquares indicate data points for mirror motion. The solid lines in all panels represent the predictions from the model described in Model.

References

    1. Beeler GW. Visual threshold changes resulting from spontaneous saccadic eye movements. Vision Res. 1967;7:769–775. - PubMed
    1. Bridgeman B. Mechanisms of space constancy. In: Hein A, Jeannerod M, editors. Spatially oriented behavior. Springer; New York: 1983. pp. 263–279.
    1. Burr DC, Morrone MC. Impulse response functions for chromatic and achromatic stimuli. J Opt Soc Am A. 1993;10:1706–1713.
    1. Burr DC, Morrone MC. Temporal impulse response functions for luminance and color during saccades. Vision Res. 1996;36:2069–2078. - PubMed
    1. Burr DC, Holt J, Johnstone JR, Ross J. Selective depression of motion selectivity during saccades. J Physiol (London) 1982;333:1–15. - PMC - PubMed

Publication types

LinkOut - more resources