. 2000 May;115(5):559-70.
doi: 10.1085/jgp.115.5.559.

Specific and nonspecific effects of protein kinase C on the epithelial Na (+) channel

Affiliations

Specific and nonspecific effects of protein kinase C on the epithelial Na (+) channel

M S Awayda. J Gen Physiol. 2000 May.

Abstract

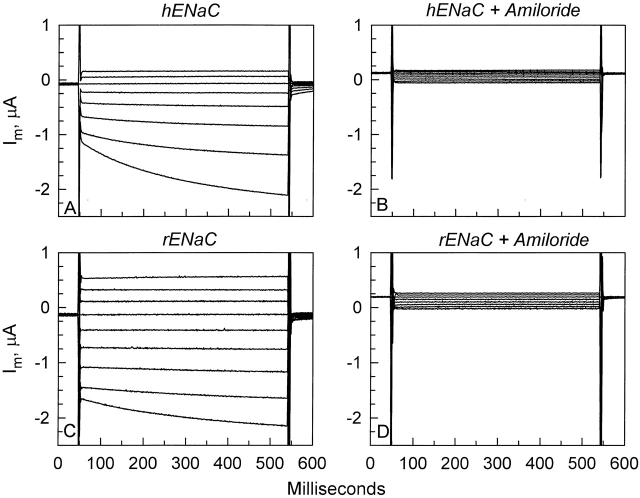
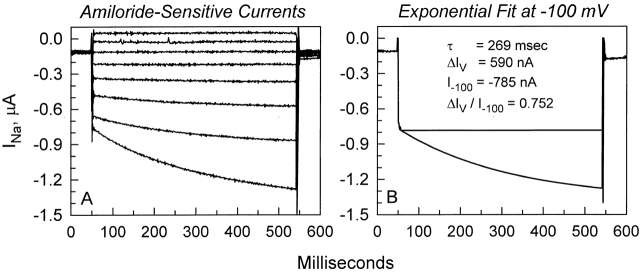
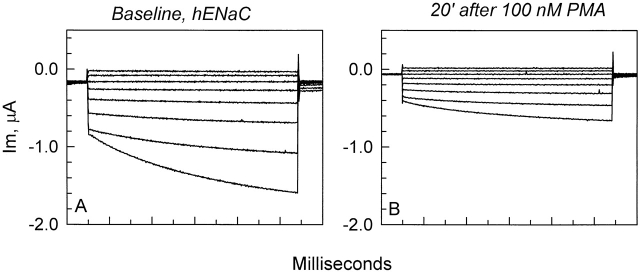
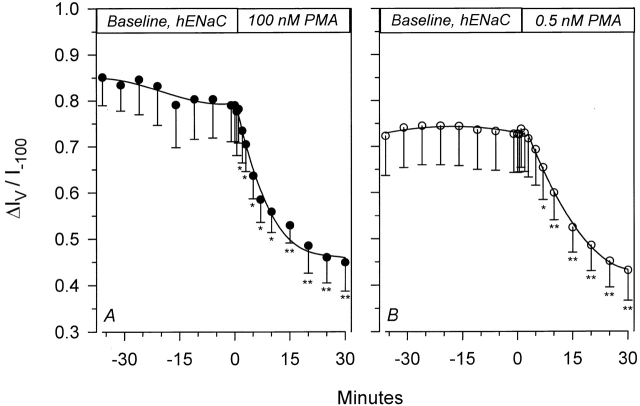
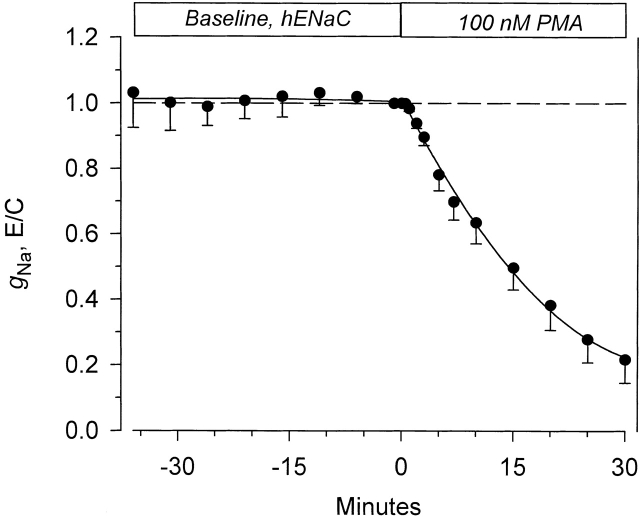
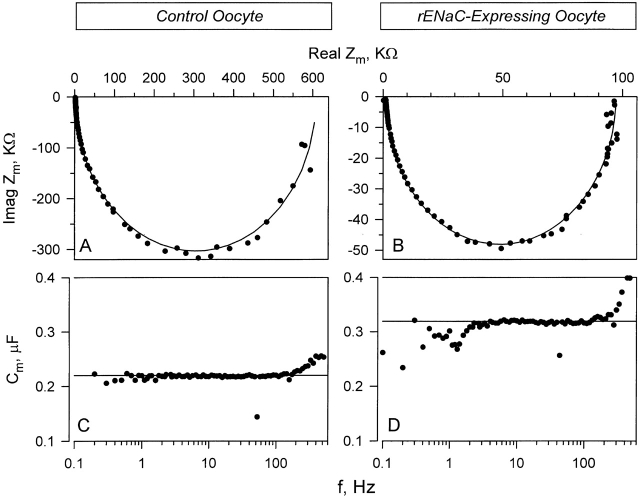
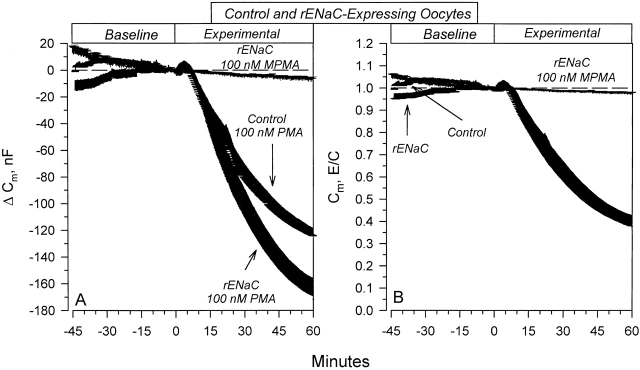
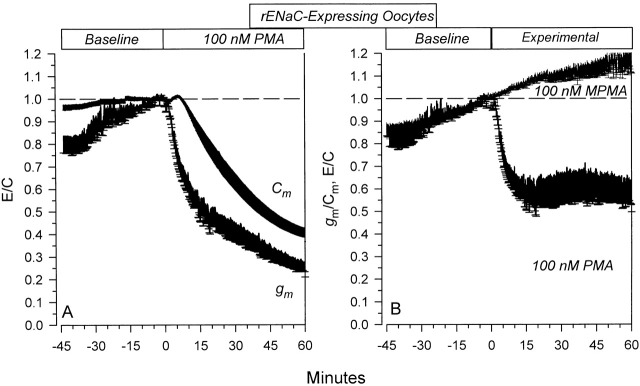
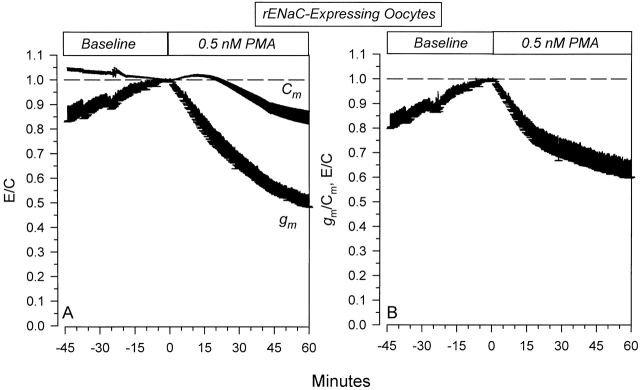
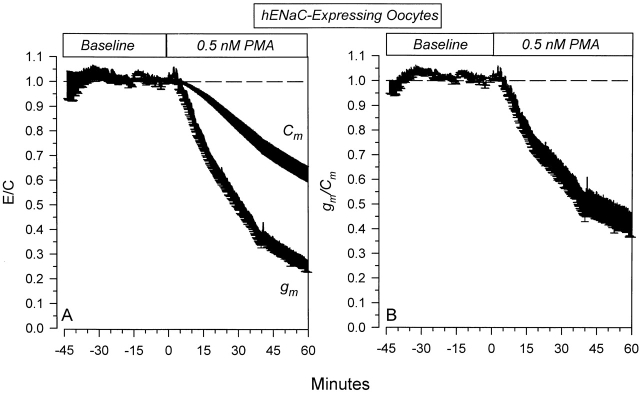
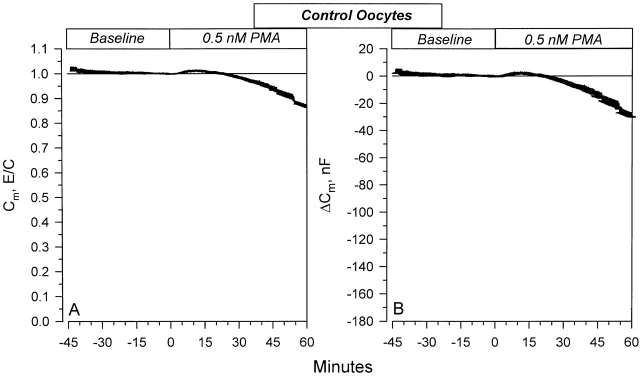
The Xenopus oocyte expression system was used to explore the mechanisms of inhibition of the cloned rat epithelial Na(+) channel (rENaC) by PKC (Awayda, M.S., I.I. Ismailov, B.K. Berdiev, C.M. Fuller, and D.J. Benos. 1996. J. Gen. Physiol. 108:49-65) and to determine whether human ENaC exhibits similar regulation. Effects of PKC activation on membrane and/or channel trafficking were determined using impedance analysis as an indirect measure of membrane area. hENaC-expressing oocytes exhibited an appreciable activation by hyperpolarizing voltages. This activation could be fit with a single exponential, described by a time constant (tau) and a magnitude (DeltaI (V)). A similar but smaller magnitude of activation was also observed in oocytes expressing rENaC. This activation likely corresponds to the previously described effect of hyperpolarizing voltage on gating of the native Na(+) channel (Palmer, L.G., and G. Frindt. 1996. J. Gen. Physiol. 107:35-45). Stimulation of PKC with 100 nM PMA decreased DeltaI(V) in hENaC-expressing oocytes to a plateau at 57.1 +/- 4.9% (n = 6) of baseline values at 20 min. Similar effects were observed in rENaC-expressing oocytes. PMA decreased the amiloride-sensitive hENaC slope conductance (g(Na)) to 21.7 +/- 7.2% (n = 6) of baseline values at 30 min. This decrease was similar to that previously reported for rENaC. This decrease of g (Na) was attributed to a decrease of membrane capacitance (C (m)), as well as the specific conductance (g(m)/C(m )). The effects on g(m)/C(m) reached a plateau within 15 min, at approximately 60% of baseline values. This decrease is likely due to the specific ability of PKC to inhibit ENaC. On the other hand, the decrease of C(m) was unrelated to ENaC and is likely an effect of PKC on membrane trafficking, as it was observed in ENaC-expressing as well as control oocytes. At lower PMA concentrations (0.5 nM), smaller changes of C(m) were observed in rENaC- and hENaC-expressing oocytes, and were preceded by larger changes of g(m ) and by changes of g(m)/C(m), indicating specific effects on ENaC. These findings indicate that PKC exhibits multiple and specific effects on ENaC, as well as nonspecific effects on membrane trafficking. Moreover, these findings provide the electrophysiological basis for assessing channel-specific effects of PKC in the Xenopus oocyte expression system.


Figures

Figure 1
Figure 1
Representative whole-cell currents in oocytes expressing hENaC or rENaC. (A) Oocytes expressing hENaC exhibited an appreciable activation by hyperpolarizing voltages (the most pronounced activation was observed at −100 mV and is the most negative current shown). (B) This voltage-activated current is attributed to hENaC as it is blocked by 10 μM amiloride. (C) By comparison, this activation is markedly reduced in oocytes expressing rENaC. (D) The voltage-activated currents in these oocytes were also amiloride sensitive.
Figure 2
Figure 2
Exponential fit of the voltage-activated current at −100 mV. (A) Whole-cell currents were obtained in the conventional manner by holding at 0 mV and immediately stepping the voltage from −100 to +40 mV in 20-mV increments for a period of 500 ms. (B) The current at −100 mV is fitted to a single exponential. The resulting exponential fit is superimposed on the data points. To correct for expression levels, values of ΔIV are normalized by dividing with I −100. In this example, it results in a ratio of 0.752.
Figure 3
Figure 3
Representative example of the effects of 100 nM PMA on the current in hENaC-expressing oocytes. All currents are subtracted from the residual amiloride-insensitive currents. (A) Currents in the absence of PMA exhibited the voltage activation at hyperpolarizing voltages as described in Fig. 1 and Fig. 2 . (B) PMA caused an inhibition of the current at every voltage. The majority of this inhibition was observed within 15–20 min. Note that 100 nM PMA also inhibited the voltage-activated current described above in Fig. 1 and Fig. 2 .
Figure 4
Figure 4
Time course of inhibition of hENaC's voltage-activated current by PMA. Voltage activation is calculated as described in materials and methods, and is normalized to I−100. Inhibition by 100 nM PMA (A) was similar to that observed with 0.5 nM PMA (B). n = 6 for each group of oocytes. *P < 0.05; **P < 0.01.
Figure 5
Figure 5
Time course of the effect of 100 nM PMA on the amiloride-sensitive slope conductance in hENaC-expressing oocytes. Amiloride-sensitive currents were calculated by subtracting the small residual currents after the addition of 10 μM amiloride at the end of each experiment. Slope conductance was calculated from the current at the end of the 500-ms pulse between a holding voltage of −100 and −80 mV (see materials and methods). PMA caused a marked decrease of gNa after a delay of 1–-2 min. Within 30 min, gNa decreased to 22% of baseline. This inhibition was similar to that previously reported for the conductance in rENaC-expressing oocytes ( n = 6).
Figure 6
Figure 6
Impedance analysis in control and rENaC-expressing oocytes. (A) Representative example of the impedance in a control oocyte plotted using the Nyquist representation. (B) Example of the impedance in a rENaC-expressing oocyte. Note the difference in the scale. (C and D) The corresponding capacitance in the control and rENaC expressing oocyte, respectively. Similar results were observed in hENaC-expressing oocytes (data not shown). In all cases, the membrane impedance can be well fit with an equivalent circuit of a parallel combination of ideal frequency-independent resistor and capacitor.
Figure 7
Figure 7
Effects of 100 nM PMA on membrane capacitance. (A) Changes of Cm in control and rENaC-expressing oocytes. Note that the changes of C m were larger in rENaC-expressing oocytes. (B) Changes of C m summarized as E/C (experimental/baseline). Note that the percent change of Cm is the same in control and rENaC-expressing oocytes. This indicates that the baseline Cm is larger in rENaC-expressing oocytes. These effects were specific to PKC activation as the inactive phorbol ester, MPMA, was without effect. n = 7 for rENaC and control oocytes treated with PMA, and n = 5 for rENaC oocytes treated with MPMA.
Figure 8
Figure 8
Specific and nonspecific effects of 100 nM PMA on rENaC-expressing oocytes. (A) Time course of the effects of PMA on Cm and g m. The calculated gm represents the membrane slope conductance at 0 mV. Note that the changes of gm preceded the changes of Cm. (B) Data are summarized as specific conductance (gm/Cm). It is clear that PMA causes a rapid decrease of gm/Cm to constant values within 15 min. These effects were not observed with MPMA. n = 7 and 5 for PMA- and MPMA-treated oocytes, respectively.
Figure 9
Figure 9
Specific and nonspecific effects of 0.5 nM PMA on rENaC-expressing oocytes. (A) Time course of the effects on Cm and gm . As with 100 nM PMA, the changes of gm preceded those of Cm. (B) Data are summarized as gm/Cm and demonstrate the presence of specific effects of PMA (n = 12).
Figure 10
Figure 10
Specific and nonspecific effects of 0.5 nM PMA on hENaC-expressing oocytes. (A) Time course of the effects on Cm and gm . Note that the changes of Cm in this group of oocytes were larger than those observed in rENaC-expressing oocytes. Nevertheless, the changes of gm preceded and exceeded those of Cm, indicating the presence of specific inhibition of hENaC by 0.5 nM PMA. (B) This specific inhibition is clearly evident in the time course of the effects on gm/Cm. These data indicate that the human homolog behaves in a similar manner to the rat homolog. Moreover, hENaC may exhibit a higher sensitivity to inhibition by PMA (n = 5).
Figure 11
Figure 11
Effects of 0.5 nM PMA on the Cm in control oocytes. A small initial transient stimulation of Cm is observed. This corresponded to a 1.5% increase at 13 min and resulted in an average increase of Cm by 3.1 nF. This increase returned to values not different from control at 25 min. The changes of Cm were smaller than those observed in ENaC-expressing oocytes in Fig. 9 and Fig. 10. Thus, activation of PKC by a low concentration of PMA indicates that a component of the effects of PKC on ENaC may involve specific channel trafficking ( n = 10).

References

    1. Aballay A. , Stahl P.D. , Mayorga L.S. Phorbol ester promotes endocytosis by activating a factor involved in endosome fusion. J. Cell Sci. 1999 ;112:2549–2557 . - PubMed
    1. Aristimuno P.C. , Good D.W. PKC isoforms in rat medullary thick ascending limbselective activation of the δ-isoform by PGE2 . Am. J. Physiol. Renal Physiol. 1997 ;272:F624–F631 . - PubMed
    1. Awayda M.S. , Ismailov I.I. , Berdiev B.K. , Fuller C.M. , Benos D.J. Protein kinase regulation of a cloned epithelial Na+ channel. J. Gen. Physiol. 1996 ;108:49–65 . - PMC - PubMed
    1. Awayda M.S. , Subramanyam M. Regulation of the epithelial Na+ channel by membrane tension. J. Gen. Physiol. 1998 ;112:97–111 . - PMC - PubMed
    1. Awayda M.S. , Van Driessche W. , Helman S.I. Frequency-dependent capacitance of the apical membrane of frog skin dielectric relaxation processes. Biophys. J. 1999 ;76:219–232 . - PMC - PubMed

Publication types