. 2000 Apr;10(4):568-76.
doi: 10.1101/gr.10.4.568.

Global properties of the metabolic map of Escherichia coli

Affiliations

Global properties of the metabolic map of Escherichia coli

C A Ouzounis et al. Genome Res. 2000 Apr.

Abstract

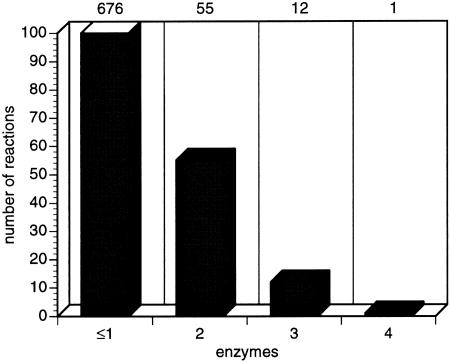
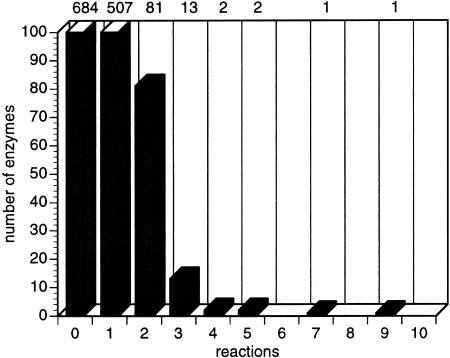
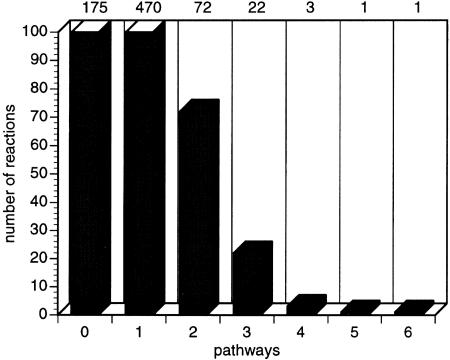
The EcoCyc database characterizes the known network of Escherichia coli small-molecule metabolism. Here we present a computational analysis of the global properties of that network, which consists of 744 reactions that are catalyzed by 607 enzymes. The reactions are organized into 131 pathways. Of the metabolic enzymes, 100 are multifunctional, and 68 of the reactions are catalyzed by >1 enzyme. The network contains 791 chemical substrates. Other properties considered by the analysis include the distribution of enzyme subunit organization, and the distribution of modulators of enzyme activity and of enzyme cofactors. The dimensions chosen for this analysis can be employed for comparative functional analysis of complete genomes.


Figures

Figure 1
Figure 1
Organization of protein complexes. The component count of a protein complex is the number of different genes whose products are contained within the complex; the subunit count of a protein complex is the number of monomers within the complex (the subunit count takes into account the coefficient of each monomer within the complex; the component count does not). (A) Distribution of subunit counts for all EcoCyc protein complexes: The predominance of monomers, dimers, and tetramers is obvious—five enzymes are not included because the coefficients of their components are not known. (B) Distribution of subunit counts as a function of component counts for all complexes. In all bar diagram figures presented herein, the actual counts are shown; if the count exceeds the y-axis, it is indicated by an open face.
Figure 1
Figure 1
Organization of protein complexes. The component count of a protein complex is the number of different genes whose products are contained within the complex; the subunit count of a protein complex is the number of monomers within the complex (the subunit count takes into account the coefficient of each monomer within the complex; the component count does not). (A) Distribution of subunit counts for all EcoCyc protein complexes: The predominance of monomers, dimers, and tetramers is obvious—five enzymes are not included because the coefficients of their components are not known. (B) Distribution of subunit counts as a function of component counts for all complexes. In all bar diagram figures presented herein, the actual counts are shown; if the count exceeds the y-axis, it is indicated by an open face.
Figure 2
Figure 2
Overview diagram of E. coli metabolism. Each node in the diagram represents a single metabolite whose chemical class is encoded by the shape of the node. Each blue line represents a single bioreaction. The white lines connect multiple occurrences of the same metabolite in the diagram. (A) This version of the overview shows all interconnections between occurrences of the same metabolite to communicate the complexity of the interconnections in the metabolic network. (B) In this version many of the metabolite interconnections have been removed to simplify the diagram; those reaction steps for which an enzyme that catalyzes the reaction is known to have a physiologically relevant activator or inhibitor are highlighted.
Figure 2
Figure 2
Overview diagram of E. coli metabolism. Each node in the diagram represents a single metabolite whose chemical class is encoded by the shape of the node. Each blue line represents a single bioreaction. The white lines connect multiple occurrences of the same metabolite in the diagram. (A) This version of the overview shows all interconnections between occurrences of the same metabolite to communicate the complexity of the interconnections in the metabolic network. (B) In this version many of the metabolite interconnections have been removed to simplify the diagram; those reaction steps for which an enzyme that catalyzes the reaction is known to have a physiologically relevant activator or inhibitor are highlighted.
Figure 3
Figure 3
The number of EC class reactions present in E. coli against the total number of EC reaction types. The blue bars (%ecoli) signify the percent contribution of each class for all known reactions in E. coli (the seven classes total 100%); the green bars (%total) signify the percent coverage of the EC classes in the known reactions in EcoCyc. Due to the apparently finer classification of classes 1–3, the two measures display an inverse relationship: More reactions in E. coli belong to classes 1–3, although they represent a smaller percentage of reactions listed in the EC hierarchy (and vice versa).
Figure 4
Figure 4
Diagram showing the number of reactions containing varying numbers of substrates (reactants plus products).
Figure 5
Figure 5
Length distribution of EcoCyc pathways; two pathways are not included because the number of steps is not known.
Figure 6
Figure 6
Diagram showing the number of reactions that are catalyzed by one or more enzymes. Most reactions are catalyzed by one enzyme, some by two, and very few by more than two enzymes.
Figure 7
Figure 7
Diagram showing the number of enzymes that catalyze one or more reactions. Most enzymes catalyze one reaction; some are multifunctional.
Figure 8
Figure 8
Diagram showing the number of reactions that participate in one or more pathways.
Figure 9
Figure 9
The distribution of the number of substrates in EcoCyc pathways. For a definition of a substrate, please see the text (Definitions).

References

    1. Bairoch A. The ENZYME data bank in 1999. Nucleic Acids Res. 1999;27:310–311. - PMC - PubMed
    1. Blattner FR, Plunket G, Bloch CA, Perna NT, Burland V, Riley M, Collado-Vides J, Glasner JD, Rode CK, Mayhew GF, et al. The complete genome sequence of Escherichia coli K-12. Science. 1997;277:1453–1474. - PubMed
    1. Goward CR, Nicholls DJ. Malate dehydrogenase: A model for structure, evolution, and catalysis. Protein Sci. 1994;3:1883–1888. - PMC - PubMed
    1. Karp PD, Riley M. Representations of metabolic knowledge. Intell Syst Mol Biol. 1993;1:207–215. - PubMed
    1. Karp PD, Paley SM. Representations of metabolic knowledge: Pathways. Intell Syst Mol Biol. 1994;2:203–211. - PubMed

Publication types

Substances

LinkOut - more resources