. 2000 Apr 25;97(9):4627-31.
doi: 10.1073/pnas.090091397.

A biological function for cadmium in marine diatoms

Affiliations

A biological function for cadmium in marine diatoms

T W Lane et al. Proc Natl Acad Sci U S A. .

Abstract

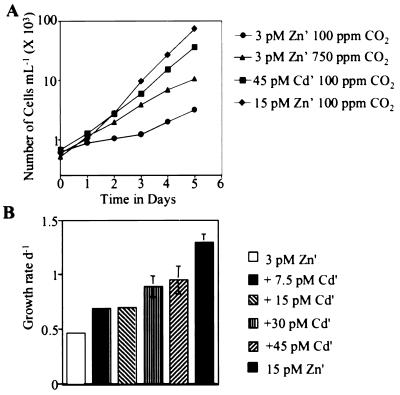
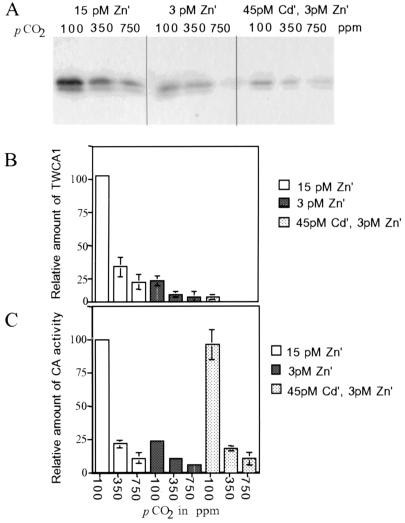
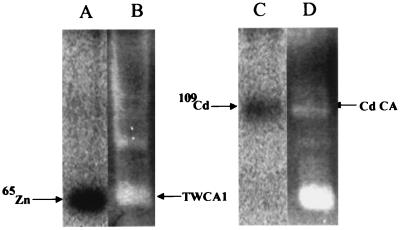
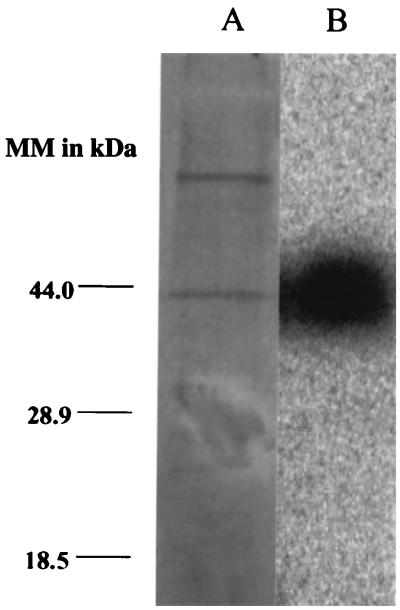
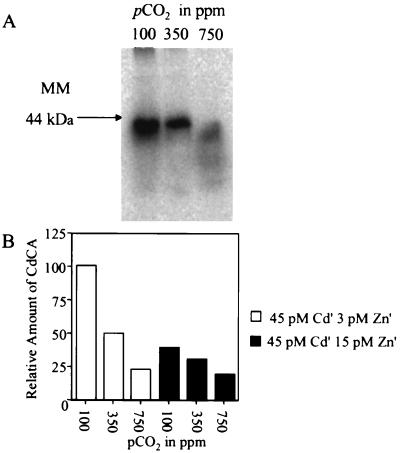
The oceanic distribution of cadmium follows closely that of major algal nutrients such as phosphate. The reasons for this "nutrient-like" distribution are unclear, however, because cadmium is not generally believed to have a biological function. Herein, we provide evidence of a biological role for Cd in the marine diatom Thalassiosira weissflogii under conditions of low zinc, typical of the marine environment. Addition of Cd to Zn-limited cultures enhances the growth rate of T. weissflogii, particularly at low pCO(2). This increase in growth rate is reflected in increased levels of cellular carbonic anhydrase (CA) activity, although the levels of TWCA1, the major intracellular Zn-requiring isoform of CA in T. weissflogii, remain low. (109)Cd label comigrates with a protein band that shows CA activity and is distinct from TWCA1 on native PAGE of radiolabeled T. weissflogii cell lysates. The levels of the Cd protein are modulated by CO(2) in a manner that is consistent with a role for this enzyme in carbon acquisition. Purification of the CA-active fraction leads to the isolation of a Cd-containing protein of 43 kDa. It is now clear that T. weissflogii expresses a Cd-specific CA, which, particularly under conditions of Zn limitation, can replace the Zn enzyme TWCA1 in its carbon-concentrating mechanism.


Figures

Figure 1
Figure 1
(A) Typical growth curves of T. weissflogii grown under different conditions of trace metals and pCO2. (B) Growth rates at 350 ppm CO2 of T. weissflogii cultures grown under different conditions of trace metals. The graph is the summary of two separate sets of cultures. Error bars represent the range of values observed (if not shown, error bars are too small to be resolved).
Figure 2
Figure 2
(A) Typical phosphorimage of a Western blot of whole-cell lysates of T. weissflogii grown under different conditions of pCO2 and trace metals. (B) Relative TWCA1 levels determined by Western analysis and phosphorimaging in cells grown under different conditions of pCO2 and Zn′. The graph represents the average of measurements from three independent sets of cultures. All measurements from the same blot were normalized to the value from the 100-ppm, 15-pM Zn culture. (C) Relative amounts of CA activity in lysates of cells grown under different conditions of pCO2 and trace metal concentrations. The graph represents the average of three measurements from each of two independent sets of cultures. Error bars represent the ranges of values measured (if not shown, error bars are too small to be resolved).
Figure 3
Figure 3
Native PAGE and CA assay of cell lysates of cells grown at 100 ppm CO2 under different trace metal concentrations. (A) Phosphorimage of a native gel of a lysate of cells grown under 15 pM Zn′ labeled with 65 Zn. (B) CA assay of the same lane shown in A. (C) Phosphorimage of a native gel of a lysate of cells grown under 3 pM Zn′ and 45 pM Cd′ labeled with 109Cd. (D) CA assay of the same lane shown in C.
Figure 4
Figure 4
SDS/PAGE of semipurified Cd-CA. (A) Silver-stained SDS gel of purified Cd-CA. (B) Phosphorimage of SDS gel of 109Cd-labeled, purified Cd-CA. MM, molecular mass.
Figure 5
Figure 5
Modulation of Cd-CA levels by trace metals and pCO2. (A) Phosphorimage of SDS/10% PAGE of total cellular protein of 109Cd-labeled cultures grown at 45 pM Cd′ and 3 pM Zn′ and the indicated pCO2. MM, molecular mass. (B) Graphic representation of results of a typical labeling experiment. 109Cd-labeled cultures were grown at 45 pM Cd′ at either 3 pM or 15 pM Zn′ at the indicated pCO2. Relative amounts of Cd-CA were determined by SDS/PAGE and phosphorimaging.

References

    1. Coleman J E. Nature (London) 1967;214:193–194. - PubMed
    1. Bruland K W. Earth Planet Sci Lett. 1980;47:176–198.
    1. Boyle E A, Sclater F, Edmond J M. Nature (London) 1976;263:42–44.
    1. Price N M, Morel F M M. Nature (London) 1990;344:658–660.
    1. Lee J G, Morel F M M. Mar Ecol Prog Ser. 1995;127:305–309.

LinkOut - more resources