

MR imaging and localized proton spectroscopy of the precentral gyrus in amyotrophic lateral sclerosis
- PMID: 10782773
- PMCID: PMC7976640
MR imaging and localized proton spectroscopy of the precentral gyrus in amyotrophic lateral sclerosis
Abstract
Background and purpose: In the search for a diagnostic test for amyotrophic lateral sclerosis (ALS), especially upper motor neuron (UMN) involvement, MR imaging and proton spectroscopy techniques have each received attention, but their findings have not been correlated. The purpose of this study was to identify relationships among the results of current techniques, taking into account the severity of clinical UMN disease, so that objective measures of the pathogenesis of ALS may be established.
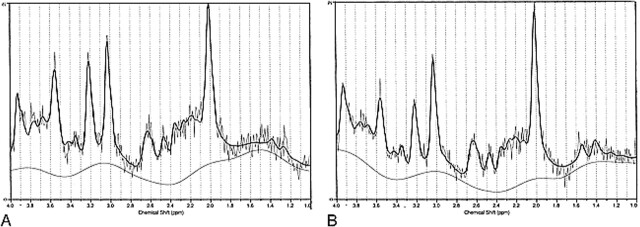
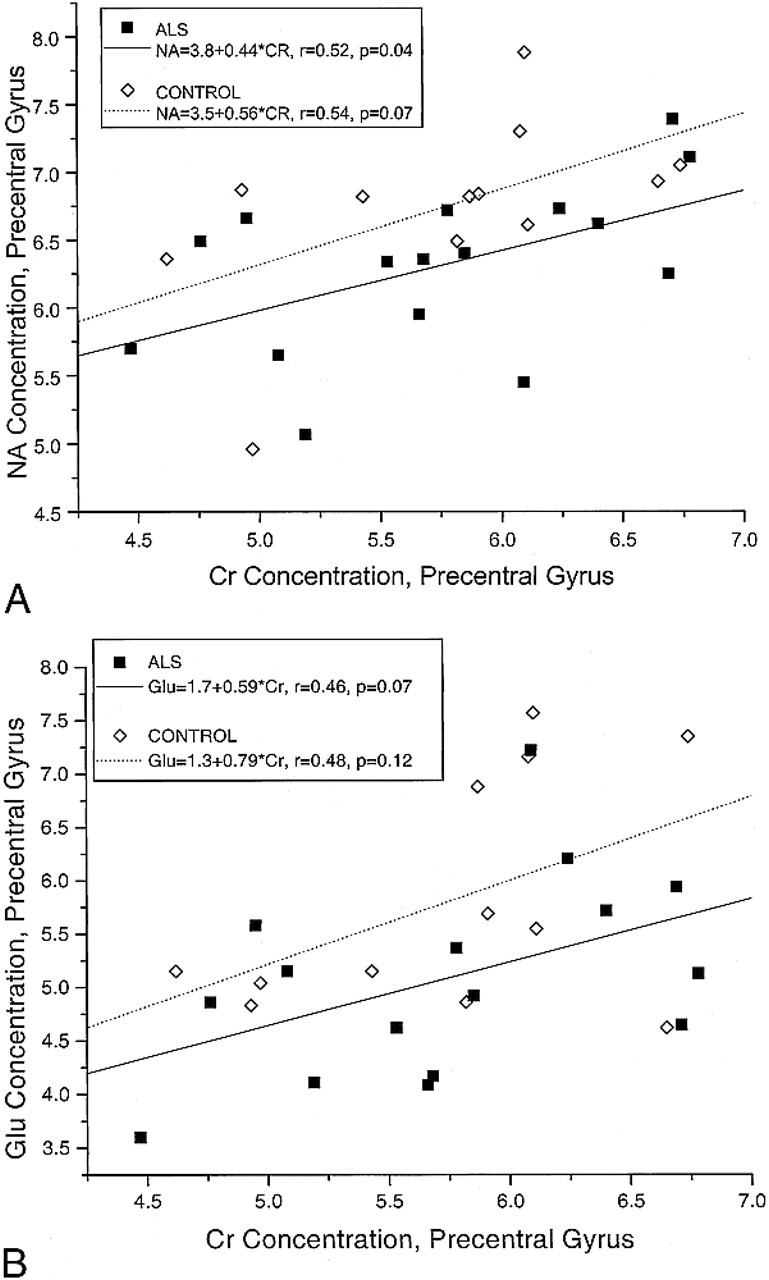
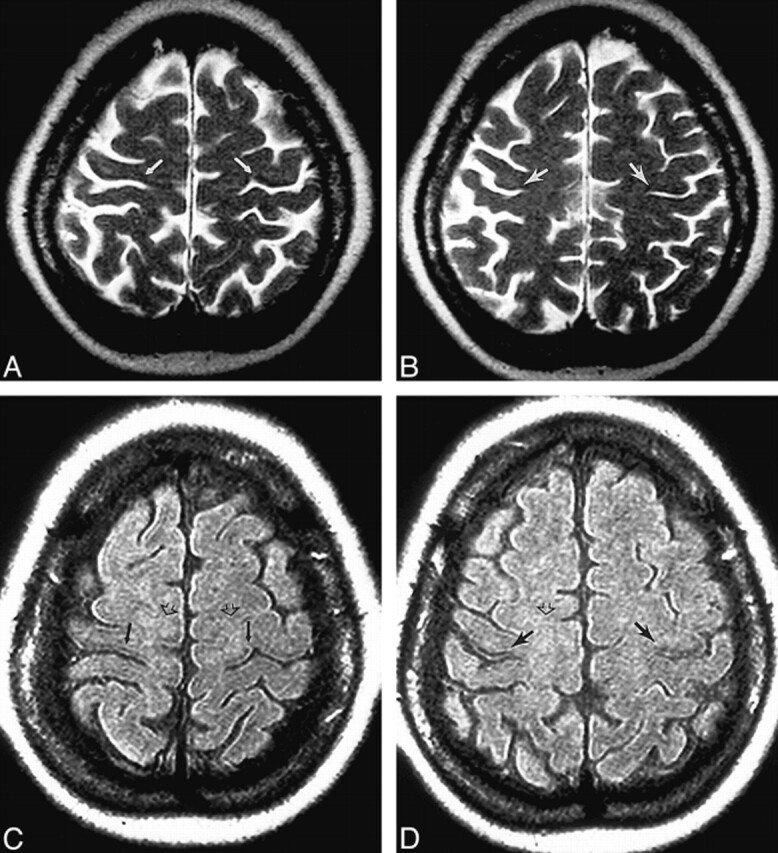
Methods: Eighteen subjects with clinically diagnosed ALS and 12 healthy volunteers underwent MR imaging of the brain and localized proton MR spectroscopy. Water-suppressed spectra from the left precentral gyrus and from the left cuneus gyrus were analyzed with the LCModel method, yielding concentrations for N-acetyl (NA), total creatine (Cr), choline (Cho), glutamate (Glu), glutamine (Gin), and myo-inositol (Ins) metabolic substrates. Signal intensities of the precentral gyrus on T2-weighted images were assessed qualitatively in a blinded fashion.
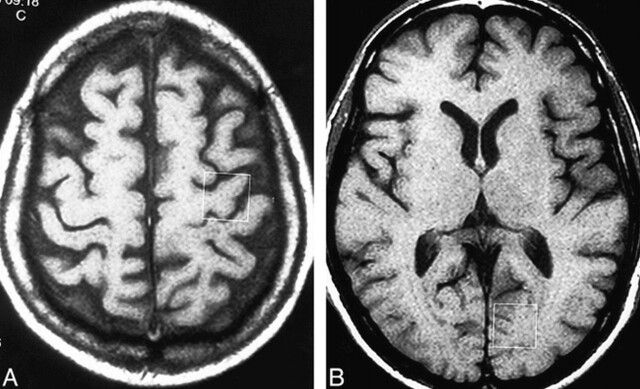
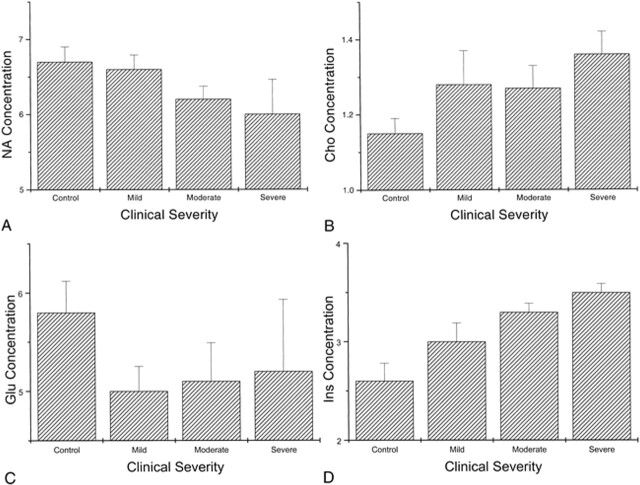
Results: For the precentral gyrus, mean Cho (1.3 mM) and Ins (3.25 mM) for the ALS group were significantly increased. After adjustment for Cr covariance, mean Glu (5.08 mM) and NA (6.31 mM) were decreased. For the cuneus gyrus, no difference in metabolite concentrations between groups was observed. Trend analysis of the precentral gyrus metabolite concentrations revealed significant increases in Cho and Ins and decreases in NA and Glu with respect to the severity of clinical UMN signs. Metabolic changes were greater in the subset of ALS patients with precentral gyrus signal changes on imaging, and significantly increased Ins was associated with cortical hypointensity on fast spin-echo images.
Conclusion: Mean metabolite concentrations determined from precentral gyrus spectra reflect clinical and pathologic changes that occur in ALS. Imaging findings, while related to the spectral and clinical results, are not specific to ALS.
Figures
References
-
- Nelson LM. Epidemiology of ALS. Clin Neurosci 1996;3:327-331 - PubMed
-
- Leigh PN. Pathogenic mechanisms in amyotrophic lateral sclerosis and other motor neuron disorders. In: Calne DB, ed Neurodegenerative Diseases Philadelphia: Saunders; 1993:473-488
-
- Brooks BR, Antel J, Bradley WG. El Escorial World Federation of Neurology Criteria for the diagnosis of amyotrophic lateral sclerosis. Neurol Sci 1994;124:96-107 - PubMed
-
- Oba H, Araki T, Ohtomo K, et al. Amyotrophic lateral sclerosis: T2 shortening in motor cortex at MR imaging. Radiology 1993;189:843-846 - PubMed
-
- Cheung G, Gawel MJ, Cooper PW, et al. Amyotrophic lateral sclerosis: correlation of clinical and MR imaging findings. Radiology 1995;194:263-270 - PubMed
Publication types
MeSH terms
LinkOut - more resources
Full Text Sources
Medical
Miscellaneous