. 2000 Mar;28(3):253-68.
doi: 10.1114/1.273.

Advection and diffusion of substances in biological tissues with complex vascular networks

Affiliations

Advection and diffusion of substances in biological tissues with complex vascular networks

D A Beard et al. Ann Biomed Eng. 2000 Mar.

Abstract

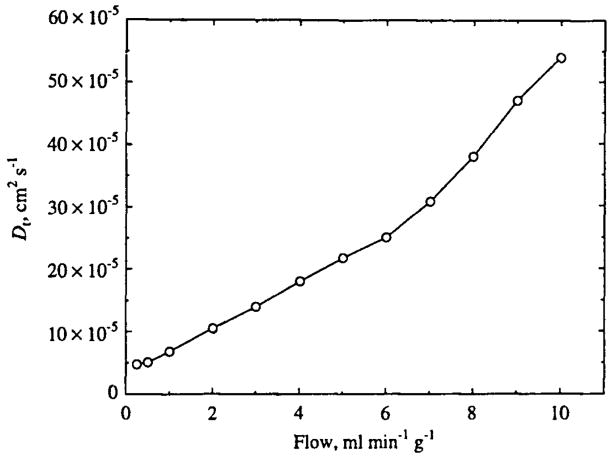
For highly diffusive solutes the kinetics of blood-tissue exchange is only poorly represented by a model consisting of sets of independent parallel capillary-tissue units. We constructed a more realistic multicapillary network model conforming statistically to morphometric data. Flows through the tortuous paths in the network were calculated based on constant resistance per unit length throughout the network and the resulting advective intracapillary velocity field was used as a framework for describing the extravascular diffusion of a substance for which there is no barrier or permeability limitation. Simulated impulse responses from the system, analogous to tracer water outflow dilution curves, showed flow-limited behavior over a range of flows from about 2 to 5 ml min(-1) g(-1), as is observed for water in the heart in vivo. The present model serves as a reference standard against which to evaluate computationally simpler, less physically realistic models. The simulated outflow curves from the network model, like experimental water curves, were matched to outflow curves from the commonly used axially distributed models only by setting the capillary wall permeability-surface area (PS) to a value so artifactually low that it is incompatible with the experimental observations that transport is flow limited. However, simple axially distributed models with appropriately high PSs will fit water outflow dilution curves if axial diffusion coefficients are set at high enough values to account for enhanced dispersion due to the complex geometry of the capillary network. Without incorporating this enhanced dispersion, when applied to experimental curves over a range of flows, the simpler models give a false inference that there is recruitment of capillary surface area with increasing flow. Thus distributed models must account for diffusional as well as permeation processes to provide physiologically appropriate parameter estimates.


Figures

FIGURE 1
FIGURE 1
Hexagonal distribution of axially aligned segments. The network is modeled as a periodic arrangement of 16 axial segment positions in the x–y plane.
FIGURE 2
FIGURE 2
The network model is arranged periodically in the z (axial) direction. An arteriolar source occurs at a z position chosen from a Gaussian distribution with mean of 500 μm and standard deviation of 50 μm. Venular sinks occur at 125±25 and 875±25 μm.
FIGURE 3
FIGURE 3
Topology of a network generated by randomly placing 160 cross-connecting segments between nearest-neighbor axial vessels. This is a two-dimensional representation of the three-dimensional model. The axial vessel number (see Fig. 1) is plotted vs the axial position. Nodes are indicated as small circles; the large filled circle indicates the arteriolar source; the large open circles indicate venular sinks. The minimum distance along a capillary between cross connections dmin is 15 μm.
FIGURE 4
FIGURE 4
Hexagonal grid in the xy plane used for numerical computation. The positions of axial vessels are indicated by closed circles.
FIGURE 5
FIGURE 5
Concentration at grid point is denoted by Ci. Concentrations in the six surrounding points in the xy plane are denoted by Ci1 through Ci6.
FIGURE 6
FIGURE 6
Intravascular tracer washout simulation from the network model for various flows. The shapes of the curves are similar. But as flow increases, the effects of diffusion are diminished. At low flows the outflow curve is relatively smooth, while at the highest flow shown (10 ml min−1 g−1), the outflow curve is not unim odal.
FIGURE 7
FIGURE 7
Simulated concentration profiles in a slice through the x-z plane are shown following injection of an impulse bolus at the arterial inflow. Each profile corresponds to a different time in the simulation. The injection point is indicated in the top slice (t=0) by an arrow. The color bar to the right indicates concentration in arbitrary units. Tracer spreads from the injection point into the venular zones with concentration remaining relatively constant in the x (and y) direction. This simulation was performed using a flow of 2 ml min−1 g−1.
FIGURE 8
FIGURE 8
Tracer washout simulation from the network model for various flows. Lower flow washouts show an earlier peak due to diffusional shunting. The diffusion coefficient D is 10−5cm2s−1.
FIGURE 9
FIGURE 9
Tracer washout simulation from the network model for various flows. A flow-limited regime exists for flows between 2 and 5 ml min−1 g−1 in which the normalized outflow curves appear similar. At higher flow (10 ml min−1 g−1) an early peak occurs due to a bolus of tracer that remains intravascular during its passage through the network. The diffusion coefficient D is 10−5cm2s−1.
FIGURE 10
FIGURE 10
Estimated permeability–surface area product PSe obtained from fitting simulated outflow data to the axially distributed two-region model described in Bassingthwaighte et al. (Ref. 10). Diamonds correspond to model fits using a heterogeneous flow model (20 parallel units) with a relative dispersion of flows equal to 40%. The circles correspond to model fits obtained from a single-tube axial distributed model.
FIGURE 11
FIGURE 11
Estimated extravascular dispersion coefficient Dt obtained from fitting simulated outflow data to an axially distributed two-region single-capillary model (see Refs. and 10) with the capillary PSe set to the value of 500 ml g−1 min−1, corresponding to the expected effective PS based on Eq. (1). Plasma diffusion Dp is 10−5cm2s−1.
FIGURE 12
FIGURE 12
Various axially distributed model fits are shown for the simulated outflow curve from the 3D network model. The solid line indicates output from the network model calculated at a flow of 5 ml min−1 g−1. The axial model approximates the network model behavior only for unrealistically low PS or high Dt.
FIGURE 13
FIGURE 13
Comparison of upwind method to minmod flux-limiter method. Outflow concentration curves following an impulse injection are plotted for the axial-distributed model with one advecting region and no permeation. Theoretical output curve (solid arrow) is a delayed impulse. The upwind method introduces substantially more dispersion than the minmod method. Grid size g=5 μm and a time step k = 0.0025 s.
FIGURE 14
FIGURE 14
Numerical and analytic solutions to Eqs. (B2) and (B3) are compared. The numerical solution (dashed line) is virtually indistinguishable from the analytic solution (solid line). The numerical method is a splitting scheme which uses the upwind method for the advection step. Grid size g=5 μm and a time step k= 0.0025 s.

References

    1. Audi SH, Dawson CA, Linehan JH, Krenz GS, Ahlf SB, Roerig DL. An interpretation of 14C-urea and 14C-primidone extraction in isolated rabbit lungs. Ann Biomed Eng. 1996;24:337–351. - PubMed
    1. Audi SH, Dawson CA, Linehan JH, Krenz GS, Ahlf SB, Roerig DL. Pulmonary disposition of lipophilic amine compounds in the isolated perfused rabbit lung. Appl Physiol. 1998;84:516–530. - PubMed
    1. Bassingthwaighte JB, Yipintsoi T, Harvey RB. Microvasculature of the dog left ventricular myocardium. Microvasc Res. 1974;7:229–249. - PMC - PubMed
    1. Bassingthwaighte JB. A concurrent flow model for extraction during transcapillary passage. Circ Res. 1974;35:483–503. - PMC - PubMed
    1. Bassingthwaighte JB. Physiology and theory of tracer washout techniques for the estimation of myocardial blood flow: Flow estimation from tracer washout. Prog Cardiovasc Dis. 1977;20:165–189. - PMC - PubMed

Publication types