. 2000 May 2;19(9):1998-2007.
doi: 10.1093/emboj/19.9.1998.

The Id4 HLH protein and the timing of oligodendrocyte differentiation

Affiliations

The Id4 HLH protein and the timing of oligodendrocyte differentiation

T Kondo et al. EMBO J. .

Abstract

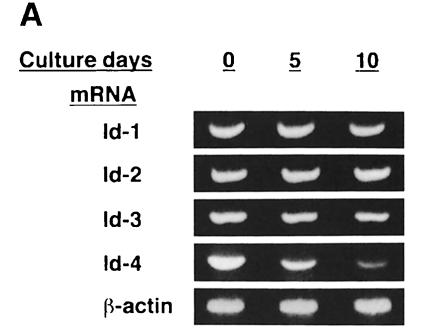
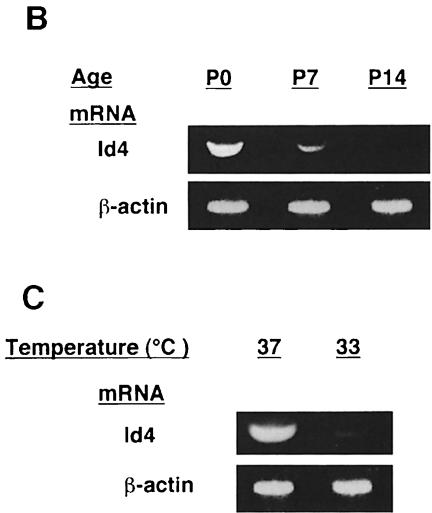
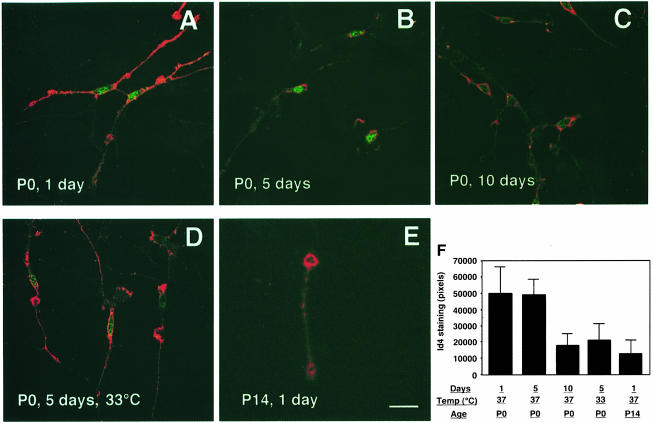
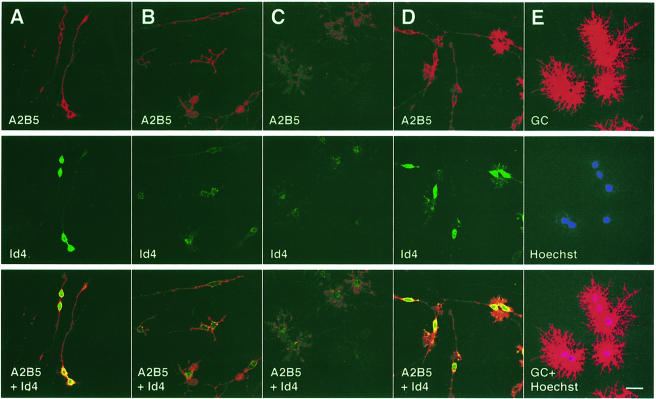
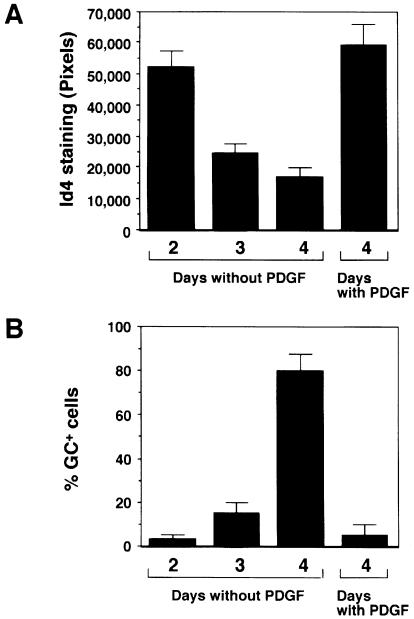
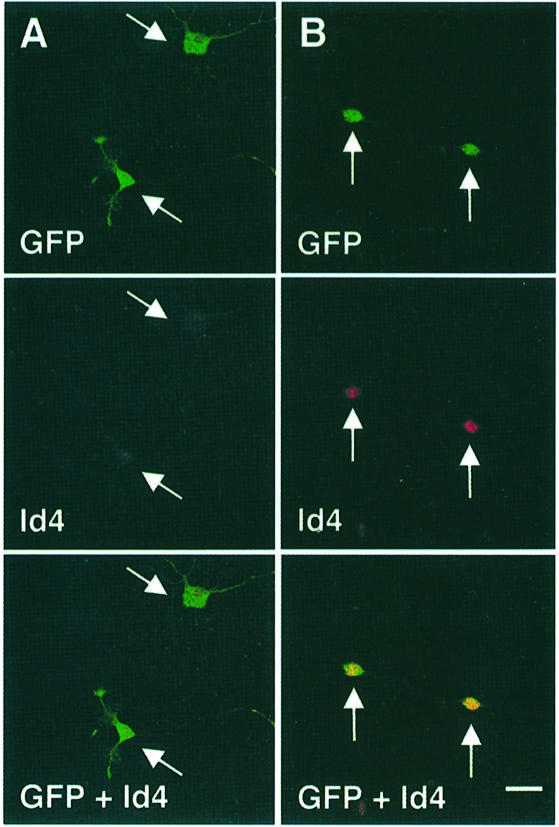
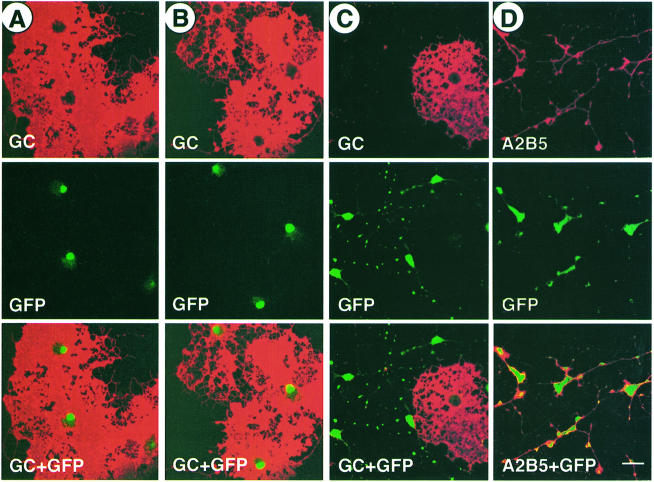
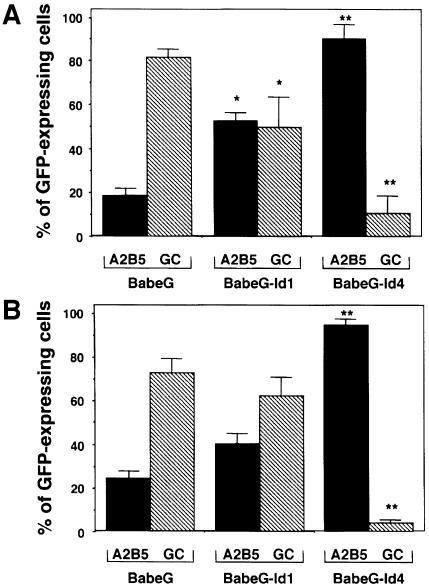
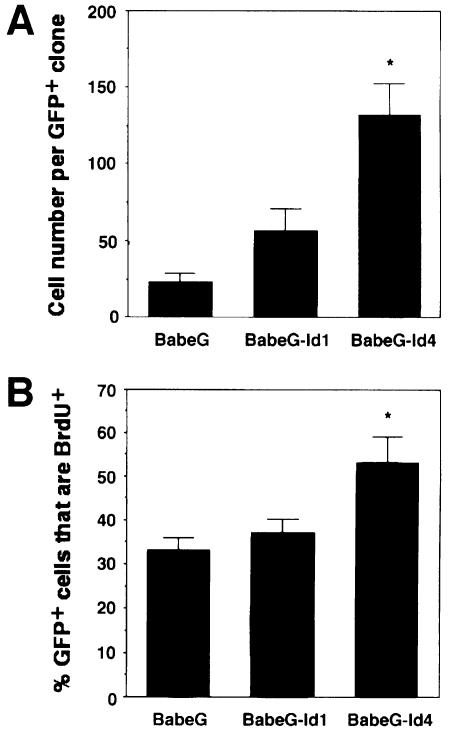
An intracellular timer is thought to help control the timing of oligodendrocyte differentiation. We show here that the expression of the helix-loop-helix gene Id4 in oligodendrocyte precursor cells decreases in vivo and in vitro with a time course expected if Id4 is part of the timer. We also show that Id4 expression decreases prematurely when the precursor cells are induced to differentiate by mitogen withdrawal. Both Id4 mRNA and protein decrease together under all of these conditions, suggesting that the control of Id4 expression is transcriptional. Finally, we show that enforced expression of Id4 stimulates cell proliferation and blocks differentiation induced by either mitogen withdrawal or treatment with thyroid hormone. These findings suggest that a progressive fall in Id4 transcription is part of the intracellular timer that helps determine when oligodendrocyte precursor cells withdraw from the cell cycle and differentiate.


Figures

None
Fig. 1. The level of Id4 mRNA in oligodendrocyte precursor cells decreases with time in vitro and in vivo and decreases more quickly in vitro at 33°C than at 37°C. The levels of mRNA were assessed by RT–PCR, and β-actin mRNA was analysed as a control. (A) Purified P0 precursor cells were studied either immediately after purification or after they were cultured for 5 or 10 days in the presence of PDGF and the absence of TH. (B) Precursor cells were purified from P0, P7 and P14 rats and analysed immediately after purification. (C) Purified P0 precursor cells were cultured for 1 day at 37°C and then for a further 4 days at either 33 or 37°C.
None
Fig. 2. Immunofluorescence staining of Id4 protein in purified oligodendrocyte precursor cells. The cells were stained for A2B5 (red), to label the precursor cells, and for Id4 (green) and then examined and photographed in a confocal microscope. P0 cells were cultured for 1 (A), 5 (B) or 10 days (C) at 37°C or for 1 day at 37°C and a further 4 days at 33°C (D). In (E), purified P14 precursor cells were cultured for 1 day. Quantification of the intensity of nuclear Id4 staining is shown in (F) as the mean ± SD of 50 cells. Scale bar, 25 µm.
None
Fig. 3. Confocal immunofluorescence micrographs of purified P0 cells induced to differentiate by PDGF withdrawal. The cells were cultured for 1 day in PDGF, washed and then cultured either for 2 (A), 3 (B) or 4 days (C and E) without PDGF or for 4 days with PDGF (D). In (A–D), cells were immunostained for A2B5 (red, top panels) and Id4 (green, middle panels); the fused images of A2B5 and Id4 staining are shown in the bottom panels. In (E), cells were cultured for 4 days without PDGF and then stained for galactocerebroside (GC) to label oligodendrocytes (top panel) and with Hoechst 33342 to label all nuclei (middle panel); the fused image of GC and Hoechst staining is shown in the bottom panel. Scale bar, 25 µm.
None
Fig. 4. Relationship between the level of Id4 protein and oligodendrocyte differentiation in cells deprived of PDGF. Purified P0 precursor cells were cultured for 1 day in PDGF, washed and then cultured for either 2, 3 or 4 days without PDGF or 4 days with PDGF. The cells were then triple stained for Id4 and GC and with Hoechst 33342. Quantification of the intensity of Id4 staining is shown in (A) as the mean ± SD of 50 cells. The proportions of Hoechst-stained cells that were GC+ are shown in (B) as the mean ± SD of three cultures.
None
Fig. 5. Expression level of Id4 protein in BabeG-infected (A) and BabeG-Id4-infected (B) cells. Purified P6 precursor cells were infected overnight with either the BabeG control virus (A) or the BabeG-Id4 virus (B). They were then cultured in PDGF without TH for another 5 days and then immunostained for Id4 (red, middle panels). The virus-infected cells were detected by the expression of GFP (green, top panels). The fused images of the antibody staining and GFP are shown in the bottom panels. Scale bar, 25 µm.
None
Fig. 6. Fluorescence micrographs illustrating the effects of Id1 and Id4 transfection on oligodendrocyte differentiation induced by PDGF withdrawal. Purified P6 precursor cells were infected overnight with either the BabeG control virus (A), the BabeG-Id1 virus (B) or the BabeG-Id4 virus (C and D). They were then cultured in PDGF without TH for another 2 days and then in the absence of PDGF for a further 3 days to induce the cells to differentiate into oligodendrocytes. The cells were immunostained for GC (A, B and C) or A2B5 (D). The antibody staining is shown in red. The virus-infected cells were detected by the expression of GFP (green, middle panels of A–C). The fused images of the antibody staining and GFP are shown in the bottom panels in (A–C). In (C), the oligodendrocyte morphology and GC+ phenotype of the uninfected cell on the right provide a striking contrast to the BabeG-Id4-infected cells, which are GC negative and look like precursor cells. Scale bar, 25 µm.
None
Fig. 7. Quantification of the effects of Id1 and Id4 transfection on oligodendrocyte differentiation induced by either PDGF withdrawal or TH addition. Purified P6 oligodendrocyte precursor cells were infected overnight with the BabeG control virus, the BabeG-Id1 virus or the BabeG-Id4 virus. They were then cultured in PDGF without TH for another 2 days. To induce oligodendrocyte differentiation, the cells were cultured either for a further 3 days in the absence of PDGF (A) or for a further 5 days in PDGF with TH (B). The proportions of GFP-expressing cells that were stained by A2B5 or anti-GC antibodies are shown as the mean ± SD of three cultures. *P <0.05 in comparison with the result of BabeG-infected cells, and **P <0.001 in comparison with the result of either BabeG- or BabeG-Id1-infected cells, when analysed by Student’s t-test.
None
Fig. 8. Effects of Id1 and Id4 transfection on cell proliferation. Purified P9 precursor cells were infected with the BabeG control virus, the BabeG-Id1 virus or the BabeG-Id4 virus. They were then cultured at clonal density in PDGF without TH. (A) The number of cells in each GFP-expressing clone was counted after 10 days and is shown as the mean ± SD of 50 clones assessed for each virus. (B) Ten days after infection, the cells were incubated with 20 µM BrdU for 8 h and then fixed and immunostained for BrdU. The proportion of GFP-expressing cells that were BrdU+ is shown as the mean ± SD of three cultures; * indicates a significant difference (A, P <0.001; B, P <0.01) from the result with either BabeG or BabeG-Id1, when analysed by Student’s t-test.

References

    1. Ahlgren S.C., Wallace,H., Bishop,J., Neophytou,C. and Raff,M. (1997) Effects of thyroid hormone on embryonic oligodendrocyte precursor cell development in vivo and in vitro. Mol. Cell. Neurosci., 9, 420–432. - PubMed
    1. Ausubel F.M., Brent,R., Kingston,R.E., Moore,D.D., Seidman,J.G., Smith,J.A. and Struhl,K. (1992) Current Protocols in Molecular Biology. Wiley, New York, NY, pp. 9.10.1–9.14.3.
    1. Barone M.V., Pepperkok,R., Peverali,F.A. and Philipson,L. (1994) Id proteins control growth induction in mammalian cells. Proc. Natl Acad. Sci. USA, 91, 4985–4988. - PMC - PubMed
    1. Barres B. and Raff,M. (1994) Control of oligodendrocyte number in the developing rat optic nerve. Neuron, 12, 935–942. - PubMed
    1. Barres B., Hart,I., Coles,H., Burne,J., Voyvodic,J., Richardson,W. and Raff,M. (1992) Cell death and control of cell survival in the oligodendrocyte lineage. Cell, 70, 31–46. - PubMed

Publication types

MeSH terms