. 2000 May 2;19(9):2069-81.
doi: 10.1093/emboj/19.9.2069.

Targeted disruption of Skp2 results in accumulation of cyclin E and p27(Kip1), polyploidy and centrosome overduplication

Affiliations

Targeted disruption of Skp2 results in accumulation of cyclin E and p27(Kip1), polyploidy and centrosome overduplication

K Nakayama et al. EMBO J. .

Abstract

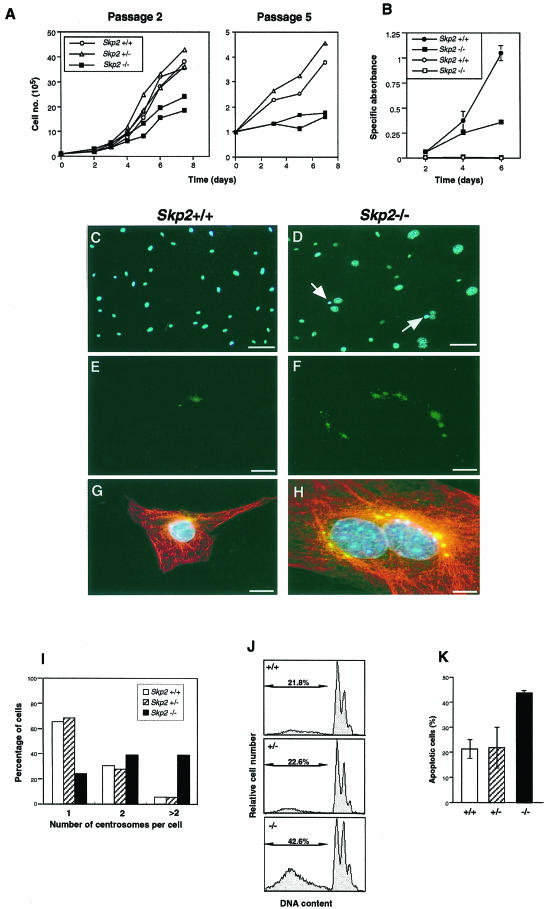
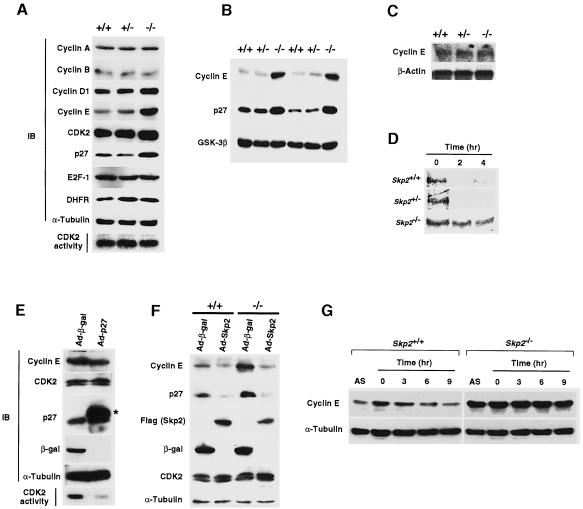
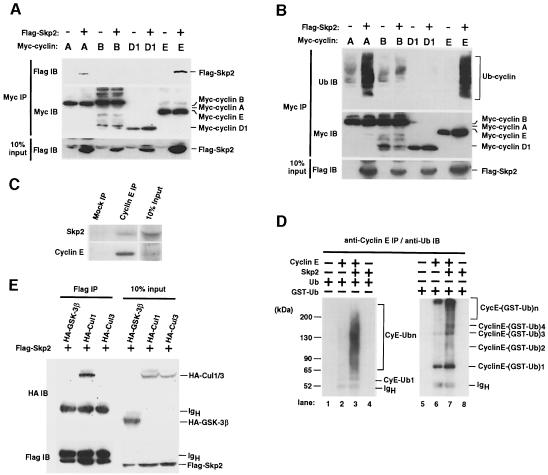
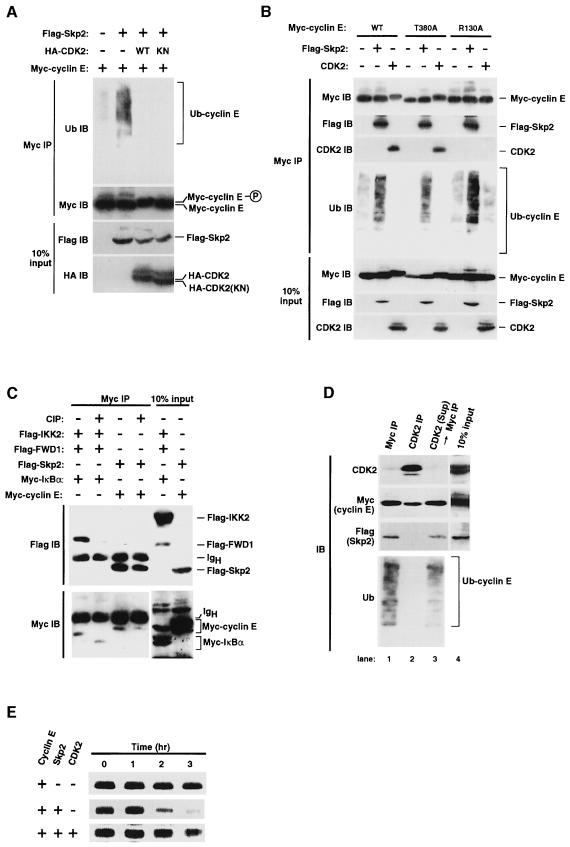
The ubiquitin-proteasome pathway plays an important role in control of the abundance of cell cycle regulators. Mice lacking Skp2, an F-box protein and substrate recognition component of an Skp1-Cullin-F-box protein (SCF) ubiquitin ligase, were generated. Although Skp2(-/-) animals are viable, cells in the mutant mice contain markedly enlarged nuclei with polyploidy and multiple centrosomes, and show a reduced growth rate and increased apoptosis. Skp2(-/-) cells also exhibit increased accumulation of both cyclin E and p27(Kip1). The elimination of cyclin E during S and G(2) phases is impaired in Skp2(-/-) cells, resulting in loss of cyclin E periodicity. Biochemical studies showed that Skp2 interacts specifically with cyclin E and thereby promotes its ubiquitylation and degradation both in vivo and in vitro. These results suggest that specific degradation of cyclin E and p27(Kip1) is mediated by the SCF(Skp2) ubiquitin ligase complex, and that Skp2 may control chromosome replication and centrosome duplication by determining the abundance of cell cycle regulators.


Figures

None
Fig. 1. Targeted disruption of mouse Skp2. (A) Structures of the targeting vector (pSKP2.KO), of the mouse Skp2 locus and of the mutant allele resulting from homologous recombination. The coding exons or portions of exons are depicted by filled boxes, and the open boxes denote the non-coding portions. A genomic fragment used as a probe for Southern blot analysis is shown as a striped box, and the expected sizes of the PstI fragments that hybridize with the probe are indicated. The positions of a set of primers (F1 and F2) used for RT–PCR analysis are also indicated. neo, the neomycin transferase gene linked to the PGK promoter; tk, thymidine kinase gene derived from herpes simplex virus linked to the PGK promoter. The orientations of both neo and tk were the same as that of Skp2. Restriction sites: E1, EcoRI; P, PstI; S2, SacII; Sm, SmaI; Xb, XbaI. Not all restriction sites are shown. (B) Southern blot analysis of genomic DNA extracted from mouse tails. The DNA was digested with PstI and subjected to hybridization with the probe shown in (A). (C) RT–PCR analysis of Skp2 (upper panel) or the β-tubulin gene (lower panel) in Skp2+/+, Skp2+/– and Skp2–/– MEFs. (D) Immunoprecipitation analysis of radiolabeled Skp2 protein in Skp2+/+ and Skp2–/– MEFs. The position of Skp2 is indicated on the right. (E) Representative male Skp2+/+ and Skp2–/– littermates at 4 weeks of age. (F) Representative growth curves of male Skp2+/+, Skp2+/– and Skp2–/– mice. Similar differences in body weight were apparent among female mice of the three genotypes (data not shown).
None
Fig. 2. Enlargement of nuclei and polyploidy in Skp2–/– cells. (A–F) Histological analysis of liver sections from adult Skp2+/+ (A and B), Skp2+/– (C and D) and Skp2–/– (E and F) mice. Sections were stained with hematoxylin and eosin (A, C and E) or with Feulgen solution (B, D and F). Scale bars, 25 µm. (G) Flow cytometric analysis of the DNA content of hepatocytes from Skp2+/+ (upper panel), Skp2+/– (middle panel) and Skp2–/– (bottom panel) mice. (H–K) Histological analysis of sections of bronchioles (H and I) and renal tubules (J and K) from Skp2+/+ (H and J) and Skp2–/– (I and K) mice. The sections were stained with hematoxylin and eosin. Scale bars, 25 µm.
None
Fig. 3. Reduced growth rate, abnormal amplification of centrosomes and increased incidence of apoptosis in the absence of Skp2. (A) Growth curves of Skp2+/+, Skp2+/– and Skp2–/– MEFs at passage 2 (left panel) and passage 5 (right panel). Data are means of duplicate plates, and each curve corresponds to MEFs from a different animal. (B) Growth curves of T lymphocytes derived from Skp2+/+ (circles) and Skp2–/– (squares) mice with (closed symbols) or without (open symbols) stimulation by immobilized anti-CD3ε and anti-CD28. Data are means ± SD of triplicate cultures and are expressed as specific absorbance (the absorbance value for cell cultures minus that for medium alone). (C and D) Enlargement of nuclei in Skp2–/– MEFs. Skp2+/+ (C) and Skp2–/–(D) MEFs were stained with Hoechst 33258 dye (blue) to reveal the size of nuclei. Arrows indicate the abnormal micronuclei detected specifically in Skp2–/– MEFs. Scale bars, 100 µm. (EH) Overduplication of centrosomes in Skp2–/– MEFs. MEFs from Skp2+/+ (E and G) and Skp2–/– (F and H) mice were stained with anti-pericentrin (green) either alone (E and F) or together with both anti-α-tubulin (red) and Hoechst 33258 DNA dye (blue) (G and H). Scale bars, 10 µm. (I) Quantitative analysis of centrosome number. Data are expressed as the percentage of cells that contained the indicated number of centrosomes. (J) Increased incidence of spontaneous apoptosis in Skp2–/– MEFs. Skp2+/+ (top panel), Skp2+/– (middle panel) and Skp2–/– (bottom panel). MEFs at passage 2 were harvested, stained with hypotonic fluorescent solution and subjected to flow cytometry. Representative results are shown, with the percentage of hypodiploid (apoptotic) cells indicated. (K) Quantitative analysis of spontaneous apoptosis in MEFs. The percentage of hypodiploid cells among Skp2+/+, Skp2+/– and Skp2–/– MEFs was determined and is expressed as the mean ± SD of values from triplicate cultures. Statistical analysis by Student’s t-test for two independent samples yielded two-tailed p-values of <0.02 and <0.05 for comparison between Skp2+/+ and Skp2–/– MEFs and between Skp2+/– and Skp2–/– MEFs, respectively.
None
Fig. 4. Accumulation of cyclin E and loss of periodicity of cyclin E expression in Skp2–/– cells. (A) Immunoblot analysis (IB) of various cell cycle regulators in MEFs from Skp2+/+, Skp2+/– and Skp2–/– mice. An in vitro assay of CDK2 kinase activity is also shown. (B) Abundance of cyclin E and p27Kip1 in fetal liver from Skp2+/+, Skp2+/– and Skp2–/– mice. Immunoblot analysis of glycogen synthase kinase-3β (GSK-3β) is also shown as a control. (C) Northern blot analysis of cyclin E mRNA in MEFs. Polyadenylated RNA prepared from Skp2+/+, Skp2+/– and Skp2–/– MEFs was subjected to Northern blot analysis with mouse cyclin E cDNA or β-actin cDNA (control) probes. (D) Pulse–chase analysis of the turnover rate of 35S-labeled cyclin E in Skp2+/+, Skp2+/– and Skp2–/– MEFs. (E) Lack of effect of p27Kip1 overexpression on the abundance of cyclin E. Wild-type MEFs were infected with recombinant adenoviral vectors encoding either β-galactosidase (Ad-β-gal) or Flag epitope-tagged p27Kip1 (Ad-p27). Immunoblot analysis (IB) as well as an in vitro assay of CDK2 kinase activity were performed. The asterisk indicates the recombinant Flag-tagged p27Kip1. (F) Reversed expression levels of cyclin E and p27Kip1 by adenoviral transfer of the Skp2 gene into Skp2–/– MEFs. Cells were infected with recombinant adenoviral vectors encoding β-galactosidase (Ad-β-gal) or Flag-tagged Skp2 (Ad-Skp2). Cell lysates subsequently were prepared and subjected to immunoblot analysis with antibodies to cyclin E, p27Kip1, Flag (for Skp2), β-galactosidase, CDK2 or α-tubulin. (G) Impaired elimination of cyclin E during S–G2 phases in Skp2-deficient MEFs. Cell lysates prepared from MEFs in asynchronous culture (AS) or at the indicated times after release from aphidicolin-induced cell cycle arrest were subjected to immunoblot analysis with anti-cyclin E or anti-α-tubulin (control).
None
Fig. 5. Interaction of Skp2 with cyclin E and its effect on cyclin E ubiquitylation. (A) Binding of Skp2 to cyclins A and E. Myc-tagged cyclins A, B, D1 or E, either alone or together with Flag-Skp2, were expressed in 293T cells. Proteins immunoprecipitated with anti-Myc (Myc IP) were analyzed by immunoblotting with anti-Flag or anti-Myc. Ten percent of the input for immunoprecipitation was also subjected to immunoblot analysis with anti-Flag. (B) Skp2-induced ubiquitylation of cyclins A and E. Immunoprecipitates prepared as in (A) were subjected to immunoblot analysis with anti-ubiquitin or anti-Myc. (C) Interaction of endogenous Skp2 with endogenous cyclin E in vivo. Proteins immunoprecipitated from lysates of Jurkat cells with anti-cyclin E or pre-immune rabbit antibodies (mock) were subjected to immunoblotting with anti-Skp2 or anti-cyclin E. Ten percent of the input for immunoprecipitation was also subjected to immunoblotting. (D) Effect of Skp2 on ubiquitylation of cyclin E in vitro. Purified recombinant proteins were incubated in the indicated combinations together with purified E1 enzyme, an S100 fraction of NIH 3T3 cell lysate and ubiquitin. Proteins immunoprecipitated from the reaction mixtures with anti-cyclin E were analyzed by immunoblotting with anti-ubiquitin. (E) Skp2 was associated with Cul1, but not Cul3. HA-tagged GSK-3β (control), Cul1 or Cul3 together with Flag-Skp2 were expressed in 293T cells. Proteins immunoprecipitated with anti-Flag were analyzed by immunoblotting with anti-HA or anti-Flag. Ten percent of the input for immunoprecipitation was also subjected to immunoblotting.
None
Fig. 6. Targeting of free cyclin E for Skp2-mediated ubiquitylation. (A) Effect of CDK2 on Skp2-mediated cyclin E ubiquitylation in vivo. Myc-tagged cyclin E either alone or together with Flag-tagged Skp2, HA-tagged wild-type (WT) CDK2 or an HA-tagged kinase-negative mutant (KN) of CDK2 were expressed in 293T cells. Proteins immunoprecipitated with anti-Myc were analyzed by immunoblotting with anti-Flag or anti-HA. Ten percent of the input for immunoprecipitation was also subjected to immunoblotting. (B) Interaction of the cyclin E mutants T380A and R130A with Skp2 and the effects of CDK2 on their ubiquitylation. Myc-tagged wild-type (WT) or mutant (T380A or R130A) cyclin E, Flag-Skp2 and HA-CDK2 were expressed in 293T cells. Proteins immunoprecipitated with anti-Myc were analyzed by immunoblotting with anti-Myc, anti-Flag, anti-CDK2 or anti-ubiquitin (this figure is overexposed compared with the others to show the basal level of cyclin E ubiquitylation). Ten percent of the input for immunoprecipitation was also subjected to immunoblotting. (C) Effect of phosphatase treatment on FWD1–IκBα and Skp2–cyclin E complexes. Myc-cyclin E, Myc-IκBα, Flag-Skp2, Flag-FWD1 and Flag-IKK2 (IκB kinase 2) were expressed in 293T cells. Proteins immunoprecipitated with anti-Myc were subjected (or not) to phosphatase (CIP) treatment and then to immunoblot analysis with anti-Flag or anti-Myc. Ten percent of the input for immunoprecipitation was also subjected to immunoblot analysis. (D) Sequential immunoprecipitation assay showing that only free cyclin E associates with Skp2 and undergoes ubiquitylation. 293T cells were transfected with expression plasmids encoding Myc-cyclin E and Flag-Skp2. Cell lysates were subjected to immunoprecipitation with anti-Myc (lane 1) or with anti-CDK2 (lane 2), and the resulting immunoprecipitates were subjected to immunoblot analysis with anti-CDK2, anti-Myc, anti-Flag or anti-ubiquitin. Cyclin E remaining in the supernatant (Sup) after immunoprecipitation with anti-CDK2 was then immunoprecipitated with anti-Myc and subjected to immunoblot analysis (lane 3). A portion of the cell lysate corresponding to 10% of the input for immunoprecipitation was also subjected to immunoblot analysis with anti-CDK2, anti-Myc or anti-Flag (lane 4). (E) Pulse–chase analysis of the effects of Skp2 and CDK2 on the turnover rate of cyclin E. Myc-cyclin E, Flag-Skp2 and CDK2 were expressed and radiolabeled in 293T cells. After incubation for the indicated times in the absence of isotope, radiolabeled proteins immunoprecipitated with the anti-Myc were analyzed by SDS–PAGE and autoradiography.

References

    1. Bai C., Sen,P., Hofmann,K., Ma,L., Goebl,M., Harper,J.W. and Elledge,S.J. (1996) SKP1 connects cell cycle regulators to the ubiquitin proteolysis machinery through a novel motif, the F-box. Cell, 86, 263–274. - PubMed
    1. Carrano A.C., Eytan,E., Hershko,A. and Pagano,M. (1999) SKP2 is required for ubiquitin-mediated degradation of the CDK inhibitor p27. Nature Cell Biol., 1, 193–199. - PubMed
    1. Clurman B.E., Sheaff,R.J., Thress,K., Groudine,M. and Roberts,J.M. (1996) Turnover of cyclin E by the ubiquitin–proteasome pathway is regulated by cdk2 binding and cyclin phosphorylation. Genes Dev., 10, 1979–1990. - PubMed
    1. Correa-Bordes J. and Nurse,P. (1995) p25Rum1 orders S phase and mitosis by acting as an inhibitor of the p34cdc2 mitotic kinase. Cell, 83, 1001–1009. - PubMed
    1. Dealy M., Nguyen,K.V.T., Lo,J., Gstaiger,M., Krek,W., Elson,D., Arbeit,J., Kipreos,E.T. and Johnson,R.S. (1999) Loss of Cul1 results in early embryonic lethality and dysregulation of cyclin E. Nature Genet., 23, 245–248. - PubMed

MeSH terms

Associated data